
😎 공부하는 징징알파카는 처음이지?
HTML에서 Python을 사용할 수 있는 PyScript (8) 본문
728x90
반응형
<본 블로그는 itadventrue 님의 블로그를 참고해서 공부하며 작성하였습니다 :-)>
https://itadventure.tistory.com/550
파도!(9) - 아보카도 판매량 그래프
'파도'는 파이스크립트 도전기의 줄임말입니다. 지난 게시글에 연재되는 글입니다 - https://itadventure.tistory.com/549 파도!(8) - 아보카도 판매량 지난 게시글에 연재되는 글입니다 - https://itadventure.tist
itadventure.tistory.com
🎄 아보카도 수치의 단위 줄이기
❗ Total Volumn 값을 10,000으로 나누어 새로운 Volume2 이라는 값을 생성
df.insert(5, 'Volume2', df['Total Volume']/10000, True)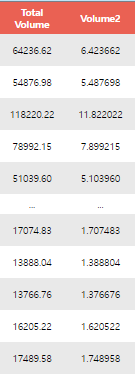
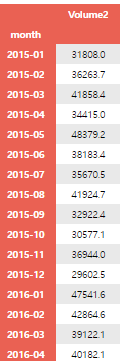
- 첫째자리까지만 표시하고 싶다면, 10,000이란 수치로 나눌때 데이터를 추가할 때 아래와 같이 round 함수를 사용
df.insert(5, 'Volume2',
  round(df['Total Volume']/10000, 1),
  True)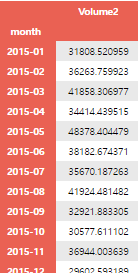
❗ 월별 매출량 조사
# 월별 매출량 조사
df_group = df.fillna(0) \
  .groupby('month')[['Volume2']] \
  .sum() \
  .sort_values(
    by='month',
    ascending=True
  )
🎄 아보카도 막대 그래프 그리기
plt.bar() 함수를 사용
❗ 그래프 크기 조정
fig = plt.figure(figsize=(15, 10))
❗ 글씨를 45도 회전
plt.xticks(rotation=45)
❗ 그리드라는 안내선을 추가
plt.grid()
❗ 월별 아보카도 매출량 그래프
<html>
    <head>
      <link rel="stylesheet" href="https://pyscript.net/alpha/pyscript.css" />
      <script defer src="https://pyscript.net/alpha/pyscript.js"></script>
      <py-env>
        - pandas
        - matplotlib
      </py-env>
    </head>
  <body>
    <link rel="stylesheet" href="pytable.css"/>
    <py-script>
      <!-- 표를 HTML 화면에 추가하는 부분을 파이썬 함수로 단순화 -->
      def createElementDiv(name):
          element = document.createElement('div')
          element.id = name
          document.body.append(element)
          return Element(name)

      import pandas as pd
      from pyodide.http import open_url

      <!-- 판다스에서 csv 를 데이터 프레임으로 읽어옴 -->
      df = pd.read_csv(open_url("http://dreamplan7.cafe24.com/pyscript/csv/avocado.csv"))

      <!-- Total Volumn 값을 10,000으로 나누어 새로운 Volume2 이라는 값을 생성 (round 를 통해 첫째 자리까지 소수자리 표시) -->
      df.insert(2, 'month', df['Date'].str[:7], True)
      df.insert(5, 'Volume2',
        round(df['Total Volume']/10000, 1),
      True)

      createElementDiv('output1').write(df)

      <!-- Volume2으로 월별 매출량 조사 -->
      df_group = df.fillna(0).groupby('month')[['Total Volume']].sum().sort_values(by='month', ascending=True)


      <!-- 월별 매출량 조사 -->
      df_group = df.fillna(0) \
      .groupby('month')[['Volume2']] \
      .sum() \
      .sort_values(
      by='month',
      ascending=True
      )

      createElementDiv('output1').write(df_group)

      <!-- 아보카도 그래프 기리기 -->
      import matplotlib.pyplot as plt

      <!-- 그래프 크기 조정 -->
      fig = plt.figure(figsize=(15, 10))
      plt.title('Month Avocado sales');

      <!-- 글씨를 45도 회전 -->
      plt.xticks(rotation=45)

      plt.bar(
        df_group.index.to_list(),
        df_group['Volume2'].to_list()
      )

      plt.xlabel('Year/Month')
      plt.ylabel('Sales(units:10000)')

      <!-- 그리드라는 안내선을 추가 -->
      plt.grid()
      fig
    </py-script>
  </body>
</html>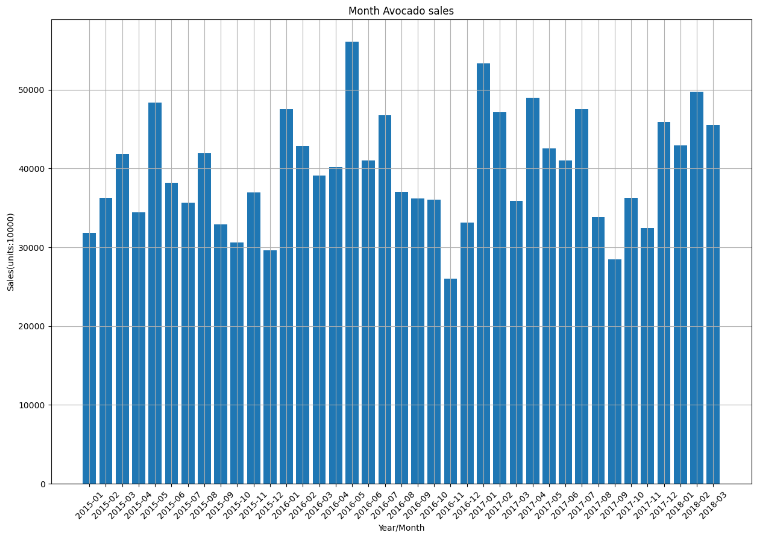
➕ xlim, ylim을 사용하여 눈금 지정하기
- 상대 변화를 확실히 보기 위해 2억 5천만부터 시작해서 6억까지 Y축을 지정
plt.yticks([
  25000, 30000, 35000, 40000,
  45000, 50000, 55000, 60000
])
- 색도 변경
# 막대 그래프
plt.bar(
  df_group.index.to_list(),
  df_group['Volume2'].to_list(),
  color='forestgreen'
)
- 수정된 그래프 코드 구현
<html>
    <head>
      <link rel="stylesheet" href="https://pyscript.net/alpha/pyscript.css" />
      <script defer src="https://pyscript.net/alpha/pyscript.js"></script>
      <py-env>
        - pandas
        - matplotlib
      </py-env>
    </head>
  <body>
    <link rel="stylesheet" href="pytable.css"/>
    <py-script>
      <!-- 표를 HTML 화면에 추가하는 부분을 파이썬 함수로 단순화 -->
      def createElementDiv(name):
          element = document.createElement('div')
          element.id = name
          document.body.append(element)
          return Element(name)

      import pandas as pd
      from pyodide.http import open_url

      <!-- 판다스에서 csv 를 데이터 프레임으로 읽어옴 -->
      df = pd.read_csv(open_url("http://dreamplan7.cafe24.com/pyscript/csv/avocado.csv"))

      <!-- Total Volumn 값을 10,000으로 나누어 새로운 Volume2 이라는 값을 생성 (round 를 통해 첫째 자리까지 소수자리 표시) -->
      df.insert(2, 'month', df['Date'].str[:7], True)
      df.insert(5, 'Volume2',
        round(df['Total Volume']/10000, 1),
      True)

      createElementDiv('output1').write(df)

      <!-- Volume2으로 월별 매출량 조사 -->
      df_group = df.fillna(0).groupby('month')[['Total Volume']].sum().sort_values(by='month', ascending=True)


      <!-- 월별 매출량 조사 -->
      df_group = df.fillna(0) \
      .groupby('month')[['Volume2']] \
      .sum() \
      .sort_values(
      by='month',
      ascending=True
      )

      createElementDiv('output1').write(df_group)

      <!-- 아보카도 그래프 기리기 -->
      import matplotlib.pyplot as plt

      <!-- 그래프 크기 조정 -->
      fig = plt.figure(figsize=(15, 10))
      plt.title('Month Avocado sales');

      <!-- 글씨를 45도 회전 -->
      plt.xticks(rotation=45)

      <!-- 상대 변화를 확실히 보기 위해 2억 5천만부터 시작해서 6억까지 Y축을 지정 -->
      plt.ylim(25000, 60000)
      <!-- y축의 눈금을 지정 -->
      plt.yticks([
        25000, 30000, 35000, 40000,
        45000, 50000, 55000, 60000
      ])

      <!-- # 막대 그래프 -->
      plt.bar(
        df_group.index.to_list(),
        df_group['Volume2'].to_list(),
        color='forestgreen'
      )

      plt.xlabel('Year/Month')
      plt.ylabel('Sales(units:10000)')

      <!-- 그리드라는 안내선을 추가 -->
      plt.grid()
      fig
    </py-script>
  </body>
</html>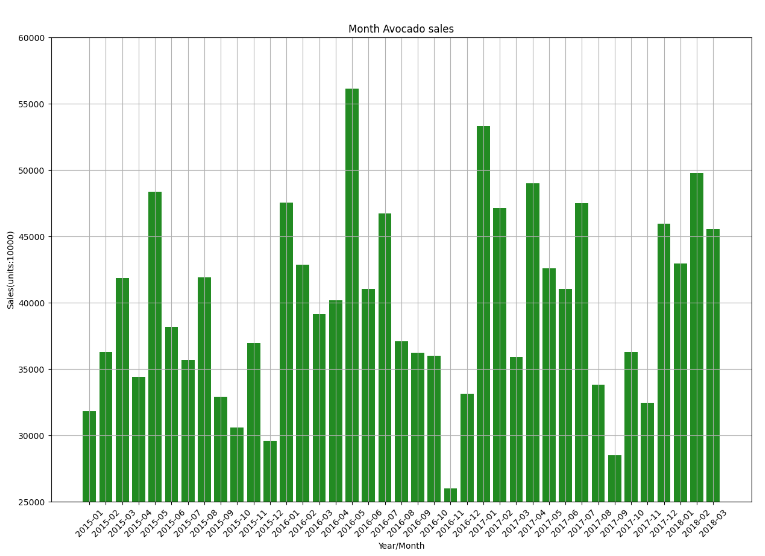
728x90
반응형
'👩💻 백엔드(Back-End) > Node js' 카테고리의 다른 글
| HTML에서 Python을 사용할 수 있는 PyScript (10) (1) | 2022.11.25 |
|---|---|
| HTML에서 Python을 사용할 수 있는 PyScript (9) (1) | 2022.11.25 |
| HTML에서 Python을 사용할 수 있는 PyScript (7) (0) | 2022.11.25 |
| HTML에서 Python을 사용할 수 있는 PyScript (6) (0) | 2022.11.25 |
| HTML에서 Python을 사용할 수 있는 PyScript (5) (0) | 2022.11.25 |
'👩💻 백엔드(Back-End)/Node js' Related Articles
more


Comments