목록👩💻 인공지능 (ML & DL) (100)
😎 공부하는 징징알파카는 처음이지?
🌟 Train Set Train set은 온전히 모델의 학습만을 위해서 사용 parameter나 feature등을 수정해서 모델의 성능을 높이는 작업을 거칠때 사용 🌟Validation Set Validation set과 test set은 모델의 학습에 직접적으로 관여하지 않음 학습이 끝난 모델에 적용시켜 test set을 이용한 모델의 평가로 넘어가기 이전에 최종적으로 모델을 fine tuning하는데에 사용 만든 모델이 test set 에서, 그리고 실제로 배포 되었을때 높은 성능을 낼 수 있도록 만들어 줌 🌟Test Set Test set은 최종적으로 우리가 만든 모델의 성능을 평가하기 위한 데이터셋 모델의 학습에는 전혀 사용되지 않음 모델이 배포된 이후에 실사용 되었을때 모델이 얼마나 좋은 성능을..
 모델 파라미터 batch, epoch, learning rate란?
batch_size : 매 훈련 단계마다 학습할 데이터의 크기를 결정 epoch : 배치 사이즈로 분할된 훈련 데이터 전체를 1회 학습하는 횟수를 몇 번 반복할지 learning rate : 모델의 weight이 업데이트 될 때마다 예상 오류에 대한 응답으로 모델을 조정 🐇 Learning rate 클 때 한 번의 step에서 학습이 크게 진행 보폭이 크기 때문에 좀 더 빨리 수렴 오버슛이 심하게 일어나 loss가 전혀 줄지 않음 🐇 Learning rate 작을 때 step 보폭이 작아 조금씩 학습 작은 보폭 때문에 local minima에 빠짐 🦞 batch_size 클 때 한 번 학습할 때 많은 데이터로 학습 batch가 크면 계산되는 loss값의 편차가 작아 과적합 위험 🦞 batch_size 작..
 csv 데이터로 미래 예측 LSTM 모델 만들기
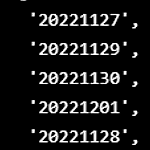
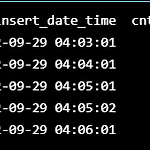
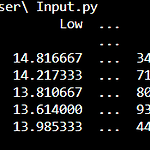
🦞 전처리 하기 전에 데이터 구경~ 🐸1. 여러 폴더 안에 CSV 파일 합치기 import numpy as np # linear algebra import pandas as pd # data processing, CSV file I/O (e.g. pd.read_csv) import matplotlib.pyplot as plt import math as math %matplotlib inline import pickle import os # Load the data forder_list = os.listdir("./DATA") forder_list csv1 = [] csv2 = [] csv3 = [] csv4 = [] csv5 = [] csv6 = [] for forder in forder_list : p..
 [Keras] Timeseries anomaly detection using an Autoencoder
https://keras.io/examples/timeseries/timeseries_anomaly_detection/#introduction Keras documentation: Timeseries anomaly detection using an Autoencoder Timeseries anomaly detection using an Autoencoder Author: pavithrasv Date created: 2020/05/31 Last modified: 2020/05/31 Description: Detect anomalies in a timeseries using an Autoencoder. View in Colab • GitHub source Introduction This script demo..
 Self-supervised Learning(자기주도학습) 와 Supervised Contrastive Learing
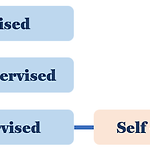
https://daeun-computer-uneasy.tistory.com/37 [CV] Self-supervised learning(자기주도학습)과 Contrastive learning - 스스로 학습하는 알고리즘 오늘은 Self-supervised learning(자기주도학습)과 주된 학습 방법인 Contrastive learning에 대해 포스팅하겠습니다. 먼저 Self supervised learning이 왜 필요한지부터 살펴보겠습니다. Self-supervised learning의 필요 daeun-computer-uneasy.tistory.com 🌰 자기주도학습(Self-supervised learning) 딥러닝 학습에는 충분한 양질의 데이터가 필요 이러한 데이터들의 지도학습을 위해서는 라벨링..
 Dash와 Python을 사용하여 사용자 입력 기반 그래프
https://pythonprogramming.net/dynamic-data-visualization-application-dash-python-tutorial/ Python Programming Tutorials Dynamic Graph based on User Input - Data Visualization GUIs with Dash and Python p.3 Welcome to part three of the web-based data visualization with Dash tutorial series. Up to this point, we've learned how to make a simple graph and how to dynamically upda pythonprogramming.net..
 Dash와 Python을 사용하여 실시간 업데이트 그래프를 생성
https://pythonprogramming.net/live-graphs-data-visualization-application-dash-python-tutorial/ Python Programming Tutorials Live Graphs - Data Visualization GUIs with Dash and Python p.4 Welcome to part four of the web-based data visualization with Dash tutorial series. In this tutorial, we're going to be create live updating graphs with Dash and Python. Live graphs can be usef pythonprogramming..
 CNN-LSTM 으로 시계열 분석하기
https://data-newbie.tistory.com/31 모델평가와 성능평가 _미완성 도움이 되셨다면, 광고 한번만 눌러주세요. 블로그 관리에 큰 힘이 됩니다 ^^ 지도와 비지도 다양한 머신러닝 알고리즘 살펴봄 -> 모델 평가와 매개변수 선택에 대해 알아보자 비지도 학습은 선 data-newbie.tistory.com 🥕 1D CNN (1 Dimensional Convolution Neural Network) CNN 모델은 1D, 2D, 3D로 나뉘는데, 일반적인 CNN은 보통 이미지 분류에 사용되는 2D를 통칭 D는 차원을 뜻하는 dimensional의 약자로, 인풋 데이터 형태에 따라 1D, 2D, 3..