
😎 공부하는 징징알파카는 처음이지?
Dash와 Python을 사용하여 실시간 업데이트 그래프를 생성 본문
728x90
반응형
<본 블로그는 pythonprogramming_net 블로그를 참고해서 공부하며 작성하였습니다>
https://pythonprogramming.net/live-graphs-data-visualization-application-dash-python-tutorial/
Python Programming Tutorials
Live Graphs - Data Visualization GUIs with Dash and Python p.4 Welcome to part four of the web-based data visualization with Dash tutorial series. In this tutorial, we're going to be create live updating graphs with Dash and Python. Live graphs can be usef
pythonprogramming.net
🔔 Dash 기본 구조
- dash lib, 다양한 구성 요소(그래프 구성 요소와 같은 것), HTML 구성 요소(div 태그 등...등)와 같은 것을 가져옴
- Dash는 Flask프레임워크를 중심으로 구축
import dash
import dash_core_components as dcc
import dash_html_components as html
app = dash.Dash()app.layout = html.Div('Dash Tutorials')if __name__ == '__main__':
app.run_server(debug=True)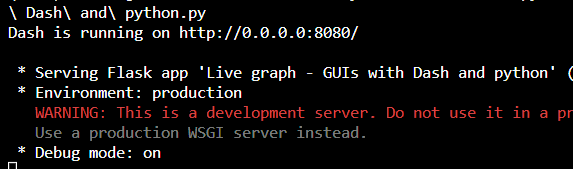
🔔 실시간 업데이트 그래프
import dash
from dash.dependencies import Output, Input
import dash_core_components as dcc
import dash_html_components as html
import plotly
import random
import plotly.graph_objs as go
from collections import deque

X = deque(maxlen=20)
X.append(1)
Y = deque(maxlen=20)
Y.append(1)

# 임의의 움직임을 추가하여 일부 데이터를 시뮬레이션
app = dash.Dash(__name__)
app.layout = html.Div(
    [
        dcc.Graph(id='live-graph', animate=True),
        dcc.Interval(
            id='graph-update',
            interval=1*1000
        ),
    ]
)

# 임의의 데이터를 추가
@app.callback(Output('live-graph', 'figure'),
              [Input('graph-update', 'n_intervals')])

def update_graph_scatter(input_data):
    X.append(X[-1]+1)
    Y.append(Y[-1]+Y[-1]*random.uniform(-0.1,0.1))

    # 함수가 실행될 때마다 몇 가지 새로운 데이터를 추가했으므로 계속해서 그래프를 작성하려고 함
    data = plotly.graph_objs.Scatter(
            x=list(X),
            y=list(Y),
            name='Scatter',
            mode= 'lines+markers'
            )

    # x와 y에 대한 목록을 전달해야 하므로 deque개체를 유지할 수 없음
    return {'data': [data],'layout' : go.Layout(xaxis=dict(range=[min(X),max(X)]),
                                                yaxis=dict(range=[min(Y),max(Y)]),)}

if __name__ == '__main__':
    app.run_server(host='0.0.0.0', port=8080 ,debug=True)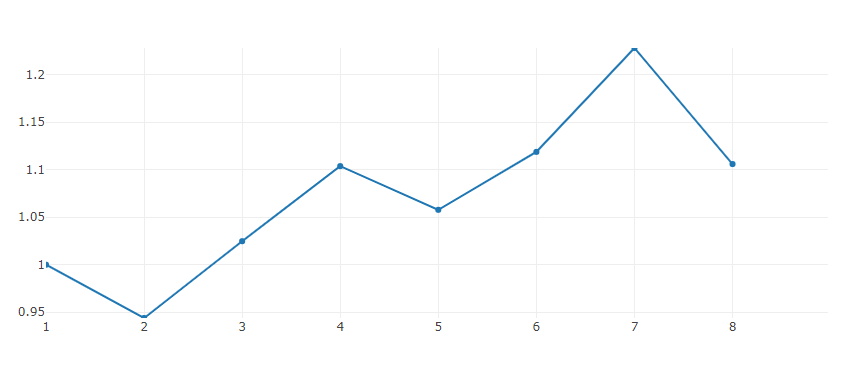
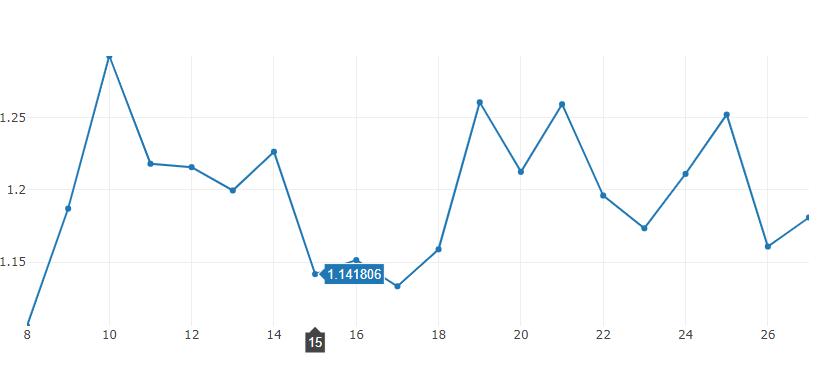
값이 누적되지 않음
728x90
반응형
'👩💻 인공지능 (ML & DL) > Serial Data' 카테고리의 다른 글
| csv 데이터로 미래 예측 LSTM 모델 만들기 (0) | 2022.12.08 |
|---|---|
| Dash와 Python을 사용하여 사용자 입력 기반 그래프 (0) | 2022.11.14 |
| CNN-LSTM 으로 시계열 분석하기 (0) | 2022.11.04 |
| Serial Data 장애 예측/감지 LSTM & Conv 모델 (0) | 2022.10.28 |
| 코로나 확진 예방을 위해 시계열(Time-Series) 데이터로 LSTM 예측 모델만들기 (1) | 2022.10.26 |
'👩💻 인공지능 (ML & DL)/Serial Data' Related Articles
more


Comments