
😎 공부하는 징징알파카는 처음이지?
VSCode 에 Dash 실행하기 본문
220927 작성
<본 블로그는 dschloe 님의 블로그를 참고해서 공부하며 작성하였습니다 :-) >
https://dschloe.github.io/python/dash/dash_project/
Python Dash를 활용한 대시보드 만들기 with Heroku
강의 홍보 취준생을 위한 강의를 제작하였습니다. 본 블로그를 통해서 강의를 수강하신 분은 게시글 제목과 링크를 수강하여 인프런 메시지를 통해 보내주시기를 바랍니다. 스타벅스 아이스 아
dschloe.github.io
1️⃣ 데이터 수집
https://www.kaggle.com/neuromusic/avocado-prices
avocado.csv

2️⃣ anaconda 가상환경 및 라이브러리 설치
- 가상환경
$ conda create --name 가상환경이름 python=3.8$ conda activate 가상환경이름- 라이브러리
$ conda install dash
$ conda install pandas
$ conda install colorama- dash 설치에서 error 발생
난 구글링해서 하라는거 무작정..해버림
그러면 어느 순간 되어있음
sudo apt-get install python

sudo python -m pip install dash==version
➕ test
import dash
import dash_core_components as dcc
import dash_html_components as html
import plotly.express as px
import pandas as pd

external_stylesheets = ['https://codepen.io/chriddyp/pen/bWLwgP.css']

app = dash.Dash(__name__, external_stylesheets=external_stylesheets)

# assume you have a "long-form" data frame
# see https://plotly.com/python/px-arguments/ for more options
df = pd.DataFrame({
    "Fruit": ["Apples", "Oranges", "Bananas", "Apples", "Oranges", "Bananas"],
    "Amount": [4, 1, 2, 2, 4, 5],
    "City": ["SF", "SF", "SF", "Montreal", "Montreal", "Montreal"]
})

fig = px.bar(df, x="Fruit", y="Amount", color="City", barmode="group")

app.layout = html.Div(children=[
    html.H1(children='Hello Dash'),

    html.Div(children='''
        Dash: A web application framework for Python.
    '''),

    dcc.Graph(
        id='example-graph',
        figure=fig
    )
])

if __name__ == '__main__':
    app.run_server(debug=True,host = '127.0.0.1')
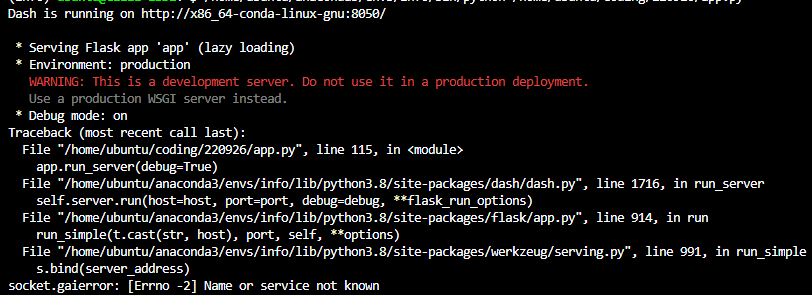
- socket error
sudo apt update -y
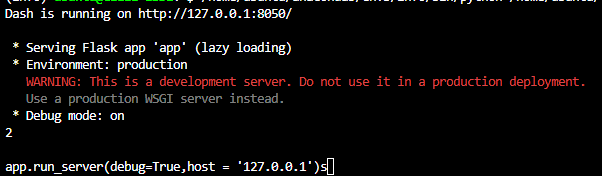
sudo apt-get install openssh-server=> 맨밑 서버 배포 코드 에서 host 다시 지정
if __name__ == '__main__':
    app.run_server(debug=True,host = '127.0.0.1')
3️⃣ 대시 보드 코드 작성
💛 데이터 수집 및 Dash 클래스 정의
# 1. data load
import dash                             # 대시보드 어플리케이션 초기화
import dash_core_components as dcc      # 동적 구성요소들(예: 그래프, 드롭다운 메뉴, 날짜 기간 등) 작성할 수 있도록 도와주는 기능
import dash_html_components as html     # html 태그에 접근
import pandas as pd                     # 데이터 수집 및 가공을 제공할 수 있는 함수 지원

# step 2. Data Import
data = pd.read_csv("coding/220926/avocado.csv", index_col=0)
data = data.query("type == 'conventional' and region == 'Albany'")      # type = conventional 과, region = Albany 만 추출하는 행을 추출
data["Date"] = pd.to_datetime(data["Date"], format="%Y-%m-%d")
data.sort_values("Date", inplace=True)                                  # 날짜의 오름차순으로 정렬하는 코드

# step 3. Dash Class
app = dash.Dash(__name__)
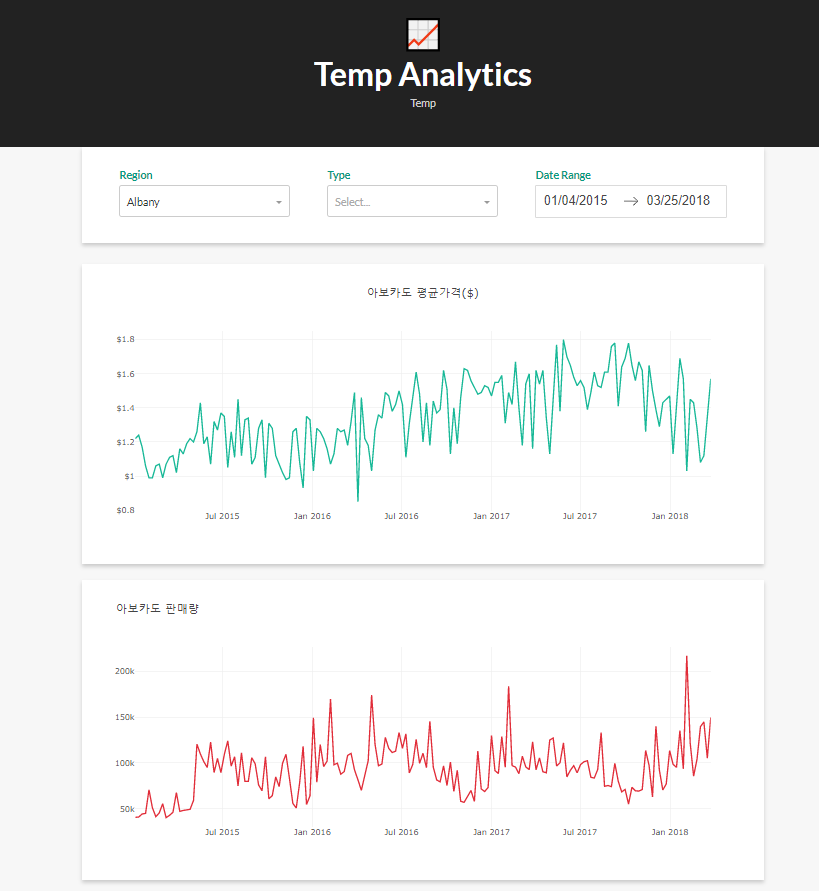
💛 대시보드 HTML Layout
# step 4. HTML
app.layout = html.Div(                              # 일종의 parent component
	  # Header Message
    children=[
        html.H1(children="Temp Analytics",),        # html.h1은 h1 태그, html.p은 p 태그
        html.P(
            children="Temp",
        ),
        # 그래프
        dcc.Graph(                                  # 그래프가 구현되는 코드
            figure={
                "data": [
                    {
                        "x": data["Date"],
                        "y": data["AveragePrice"],
                        "type": "lines",
                    },
                ],
                "layout": {"title": "Title_1"},
            },
        ),
        dcc.Graph(                                  # 그래프가 구현되는 코드
            figure={
                "data": [
                    {
                        "x": data["Date"],
                        "y": data["Total Volume"],
                        "type": "lines",
                    },
                ],
                "layout": {"title": "Title_2"},
            },
        ),
    ]
)- Dash HTML Components
- HTML components용 Wrappers를 제공 => 문단, 제목 또는 목록과 같은 요소를 작성
-
Dash Core Components
-
대화형 사용자 인터페이스를 만들기 위한 Python 추상화를 제공 => 그래프, 슬라이더 또는 드롭다운과 같은 interactive elements를 만드는 데 사용
-
💛 대시보드 배포 (localhost)
# step 5. dash board release (localhost)
"""
Flask 기반의 서버로 작동
파라미터 debug=True 를 하게되면, 수정입력을 해도 서버를 restarting 하지 않고 새로고침으로 변화를 확인
"""
if __name__ == "__main__":
    app.run_server(debug=True,host = '127.0.0.1')
💛 실행


4️⃣ 대시보드에 Style 입히기
💚 (1) 태그에 직접 style
- H1 태그에 폰트 사이즈와 색상 추가
html.H1(
    children="Temp Analytics",
    style={"fontSize": "48px", "color": "blue"},
),
- but, css 파일에 다시 관리 해주자! 위 코드에서 style 다시 지우고 assets 폴더 하위에 style.css 추가

- H1 태그에는 클래스 추가
html.H1(
    children="Temp Analytics",
    className="header_title",
),- className에 해당하는 css 코드를 style.css 에 추가
.header_title {
    font-size: 48px;
    color: red;
  }
💚 (2) 로고 추가
- 아보카도 ico 다운로드 한후 파일과 assets 폴더 하위에 추가!
💚 (3) External Style Sheet
- 외부에서 css 파일 갖고오기
# step 3. Dash Class
external_stylesheets = [
    {
        "href": "https://fonts.googleapis.com/css2?"
        "family=Lato:wght@400;700&display=swap",
        "rel": "stylesheet",
    },
]

# 외부에서 css sheet 갖고오기
app = dash.Dash(__name__, external_stylesheets=external_stylesheets)        # app = dash.Dash(__name__)
app.title = "Avocado Analytics: Understand Your Avocados!"
💚 (4) Header Layout 커스텀화
- header 화면과 그래프 구성하는 화면을 div 태그로 구분하는 코드를 작성
- className을 각 태그마다 입력하기
# step 4. HTML
app.layout = html.Div(
    children=[
        html.Div(
            children=[
                html.P(children="🥑", className="header-emoji"),
                html.H1(
                    children="Avocado Analytics", className="header-title"
                ),
                html.P(
                    children="Analyze the behavior of avocado prices"
                    " and the number of avocados sold in the US"
                    " between 2015 and 2018",
                    className="header-description",
                ),
            ],
            className="header",
        ),
        html.Div(
            children=[
                html.Div(
                    children=dcc.Graph(
                        id="price-chart",
                        config={"displayModeBar": False},
                        figure={
                            "data": [
                                {
                                    "x": data["Date"],
                                    "y": data["AveragePrice"],
                                    "type": "lines",
                                    "hovertemplate": "$%{y:.2f}"
                                                     "<extra></extra>",
                                },
                            ],
                            "layout": {
                                "title": {
                                    "text": "Average Price of Avocados",
                                    "x": 0.05,
                                    "xanchor": "left",
                                },
                                "xaxis": {"fixedrange": True},
                                "yaxis": {
                                    "tickprefix": "$",
                                    "fixedrange": True,
                                },
                                "colorway": ["#17B897"],
                            },
                        },
                    ),
                    className="card",
                ),
                html.Div(
                    children=dcc.Graph(
                        id="volume-chart",
                        config={"displayModeBar": False},
                        figure={
                            "data": [
                                {
                                    "x": data["Date"],
                                    "y": data["Total Volume"],
                                    "type": "lines",
                                },
                            ],
                            "layout": {
                                "title": {
                                    "text": "Avocados Sold",
                                    "x": 0.05,
                                    "xanchor": "left",
                                },
                                "xaxis": {"fixedrange": True},
                                "yaxis": {"fixedrange": True},
                                "colorway": ["#E12D39"],
                            },
                        },
                    ),
                    className="card",
                ),
            ],
            className="wrapper",
        ),
    ]
)- css파일
body {
    font-family: "Lato", sans-serif;
    margin: 0;
    background-color: #F7F7F7;
}

.header {
    background-color: #222222;
    height: 256px;
    display: flex;
    flex-direction: column;
    justify-content: center;
}

.header-emoji {
    font-size: 48px;
    margin: 0 auto;
    text-align: center;
}

.header-title {
    color: #FFFFFF;
    font-size: 48px;
    font-weight: bold;
    text-align: center;
    margin: 0 auto;
}

.header-description {
    color: #CFCFCF;
    margin: 4px auto;
    text-align: center;
    max-width: 384px;
}

.wrapper {
    margin-right: auto;
    margin-left: auto;
    max-width: 1024px;
    padding-right: 10px;
    padding-left: 10px;
    margin-top: 32px;
}

.card {
    margin-bottom: 24px;
    box-shadow: 0 4px 6px 0 rgba(0, 0, 0, 0.18);
}

.header_emoji {
    font-size: 48px;
    margin: 0 auto;
    text-align: center;
}

.header_title {
    color: #FFFFFF;
    font-size: 48px;
    font-weight: bold;
    text-align: center;
    margin: 0 auto;
}

.header_description {
    color: #CFCFCF;
    margin: 4px auto;
    text-align: center;
    max-width: 384px;
}

.header {
    background-color: #222222;
    height: 256px;
    display: flex;
    flex-direction: column;
    justify-content: center;
}
💚 결과

5️⃣ 대시보드에 Interactive 구현
- 날짜를 지정하여 그래프를 작성할 수는 없을까?
- 지역을 선택할 때마다, 라인 그래프가 변동시킬 수는 없을까?
🧡 (1) 메뉴 구성하기
- 데이터부터 확인
# step 2. Data Import
data = pd.read_csv("coding/220927/avocado.csv", index_col=0)
data = data.query("type == 'conventional' and region == 'Albany'")      # type = conventional 과, region = Albany 만 추출하는 행을 추출
data["Date"] = pd.to_datetime(data["Date"], format="%Y-%m-%d")
data.sort_values("Date", inplace=True)                                  # 날짜의 오름차순으로 정렬하는 코드
print(data.info())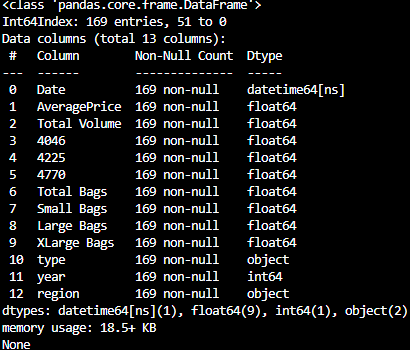
- 3가지 컬럼을 메뉴로 활용
- Region
- Type of avocado
- Date range
- type, region 확인
# step 2. Data Import
data = pd.read_csv("coding/220927/avocado.csv", index_col=0)
#data = data.query("type == 'conventional' and region == 'Albany'")      # type = conventional 과, region = Albany 만 추출하는 행을 추출
data["Date"] = pd.to_datetime(data["Date"], format="%Y-%m-%d")
data.sort_values("Date", inplace=True)                                  # 날짜의 오름차순으로 정렬하는 코드
#print(data.info())
print(data[['region', 'type', 'Date']].head())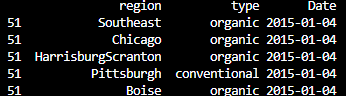
- 3가지 메뉴가 구성되도록 html.Div 를 추가하는 코드를 작성
- 드롭다운 관련 함수 설명: https://dash.plotly.com/dash-core-components
- 날짜 관련 함수 설명: https://dash.plotly.com/dash-core-components/datepickerrange
- html layout 변경
# step 4. HTML
app.layout = html.Div(
    children=[
        html.Div(
            children=[
                html.P(children="🥑", className="header-emoji"),
                html.H1(
                    children="Avocado Analytics", className="header-title"
                ),
                html.P(
                    children="Analyze the behavior of avocado prices"
                    " and the number of avocados sold in the US"
                    " between 2015 and 2018",
                    className="header-description",
                ),
            ],
            className="header",
        ),
        html.Div(
            children=[
                html.Div(
                    children=[
                        html.Div(children="Region", className="menu-title"),
                        dcc.Dropdown(
                            id="region-filter",
                            options=[
                                {"label": region, "value": region}
                                for region in np.sort(data.region.unique())
                            ],
                            value="Albany",
                            clearable=False,
                            className="dropdown",
                        ),
                    ]
                ),
                html.Div(
                    children=[
                        html.Div(children="Type", className="menu-title"),
                        dcc.Dropdown(
                            id="type-filter",
                            options=[
                                {"label": avocado_type, "value": avocado_type}
                                for avocado_type in data.type.unique()
                            ],
                            value="organic",
                            clearable=False,
                            searchable=False,
                            className="dropdown",
                        ),
                    ],
                ),
                html.Div(
                    children=[
                        html.Div(
                            children="Date Range",
                            className="menu-title"
                            ),
                        dcc.DatePickerRange(
                            id="date-range",
                            min_date_allowed=data.Date.min().date(),
                            max_date_allowed=data.Date.max().date(),
                            start_date=data.Date.min().date(),
                            end_date=data.Date.max().date(),
                        ),
                    ]
                ),
            ],
            className="menu",
        ),
        html.Div(
            children=[
                html.Div(
                    children=dcc.Graph(
                        id="price-chart", config={"displayModeBar": False},
                    ),
                    className="card",
                ),
                html.Div(
                    children=dcc.Graph(
                        id="volume-chart", config={"displayModeBar": False},
                    ),
                    className="card",
                ),
            ],
            className="wrapper",
        ),
    ]
)
👀 참고
- id : Dropdown 메뉴의 ID를 구성. 해당 ID는 향후 Callback을 정의할 때, 같이 활용됨
- optinos : Dropdown 메뉴가 최초 선택이 될 때, 값(labesl 또는 values)을 보여줌
- value : Default된 값을 보여줌
- className : style.css 이 적용되는 영역
html.Div(
    children=[
        html.Div(children="Region", className="menu-title"),
        dcc.Dropdown(
            id="region-filter",
            options=[
                {"label": region, "value": region}
                for region in np.sort(data.region.unique())
- style.css 파일에 메뉴 구성 추가
.menu {
    height: 112px;
    max-width: 1024px;
    display: flex;
    justify-content: space-evenly;
    padding-top: 32px;
    margin: 0px auto 0 auto;
    background-color: #FFFFFF;
    box-shadow: 0 4px 6px 0 rgba(0, 0, 0, 0.18);
}

.menu-title {
    margin-bottom: 6px;
    font-weight: bold;
    color: #079A82;
}

.Select-control {
    width: 256px;
    height: 48px;
}

.Select--single > .Select-control .Select-value, .Select-placeholder {
    line-height: 48px;
}

.Select--multi .Select-value-label {
    line-height: 32px;
}.
🧡 결과
- 그런데 메뉴랑 그래프가 정상적으로 안나온다
- Reactive Programming
- 실시간으로 반응을 하는 프로그래밍
- ex) 다른 유저가 페이스북에 ‘좋아요’ 버튼을 누르면 해당 포스트를 보고 있는 사용자는 새로고침 할 것 없이 실시간으로 ‘좋아요’의 개수가 올라가는 것을 말한다.
- 프로그래밍으로는 비동기 이벤트를 처리한다고 말함
- 실시간으로 반응을 하는 프로그래밍
- Callbacks
- Reactive Programming의 핵심이자, 본 Tutorial의 핵심.
- Callback 함수란, 개발자는 이벤트를 등록하기만 할 뿐, 실제 사이트 방문자가 특정 이벤트를 발생시키면, 특정 시점에 도달했을 때 해당 기능을 활성화 시키는 것
- Reactive Programming

🧡 콜백 및 Reactive 실행하는 코드 추가
from dash.dependencies import Output, Input@app.callback(
[Output("price-chart", "figure"), Output("volume-chart", "figure")],
[
Input("region-filter", "value"),
Input("type-filter", "value"),
Input("date-range", "start_date"),
Input("date-range", "end_date"),
],
)
def update_charts(region, avocado_type, start_date, end_date):
mask = (
(data.region == region)
& (data.type == avocado_type)
& (data.Date >= start_date)
& (data.Date <= end_date)
)
filtered_data = data.loc[mask, :]
price_chart_figure = {
"data": [
{
"x": filtered_data["Date"],
"y": filtered_data["AveragePrice"],
"type": "lines",
"hovertemplate": "$%{y:.2f}<extra></extra>",
},
],
"layout": {
"title": {
"text": "Average Price of Avocados",
"x": 0.05,
"xanchor": "left",
},
"xaxis": {"fixedrange": True},
"yaxis": {"tickprefix": "$", "fixedrange": True},
"colorway": ["#17B897"],
},
}
volume_chart_figure = {
"data": [
{
"x": filtered_data["Date"],
"y": filtered_data["Total Volume"],
"type": "lines",
},
],
"layout": {
"title": {"text": "Avocados Sold", "x": 0.05, "xanchor": "left"},
"xaxis": {"fixedrange": True},
"yaxis": {"fixedrange": True},
"colorway": ["#E12D39"],
},
}
return price_chart_figure, volume_chart_figure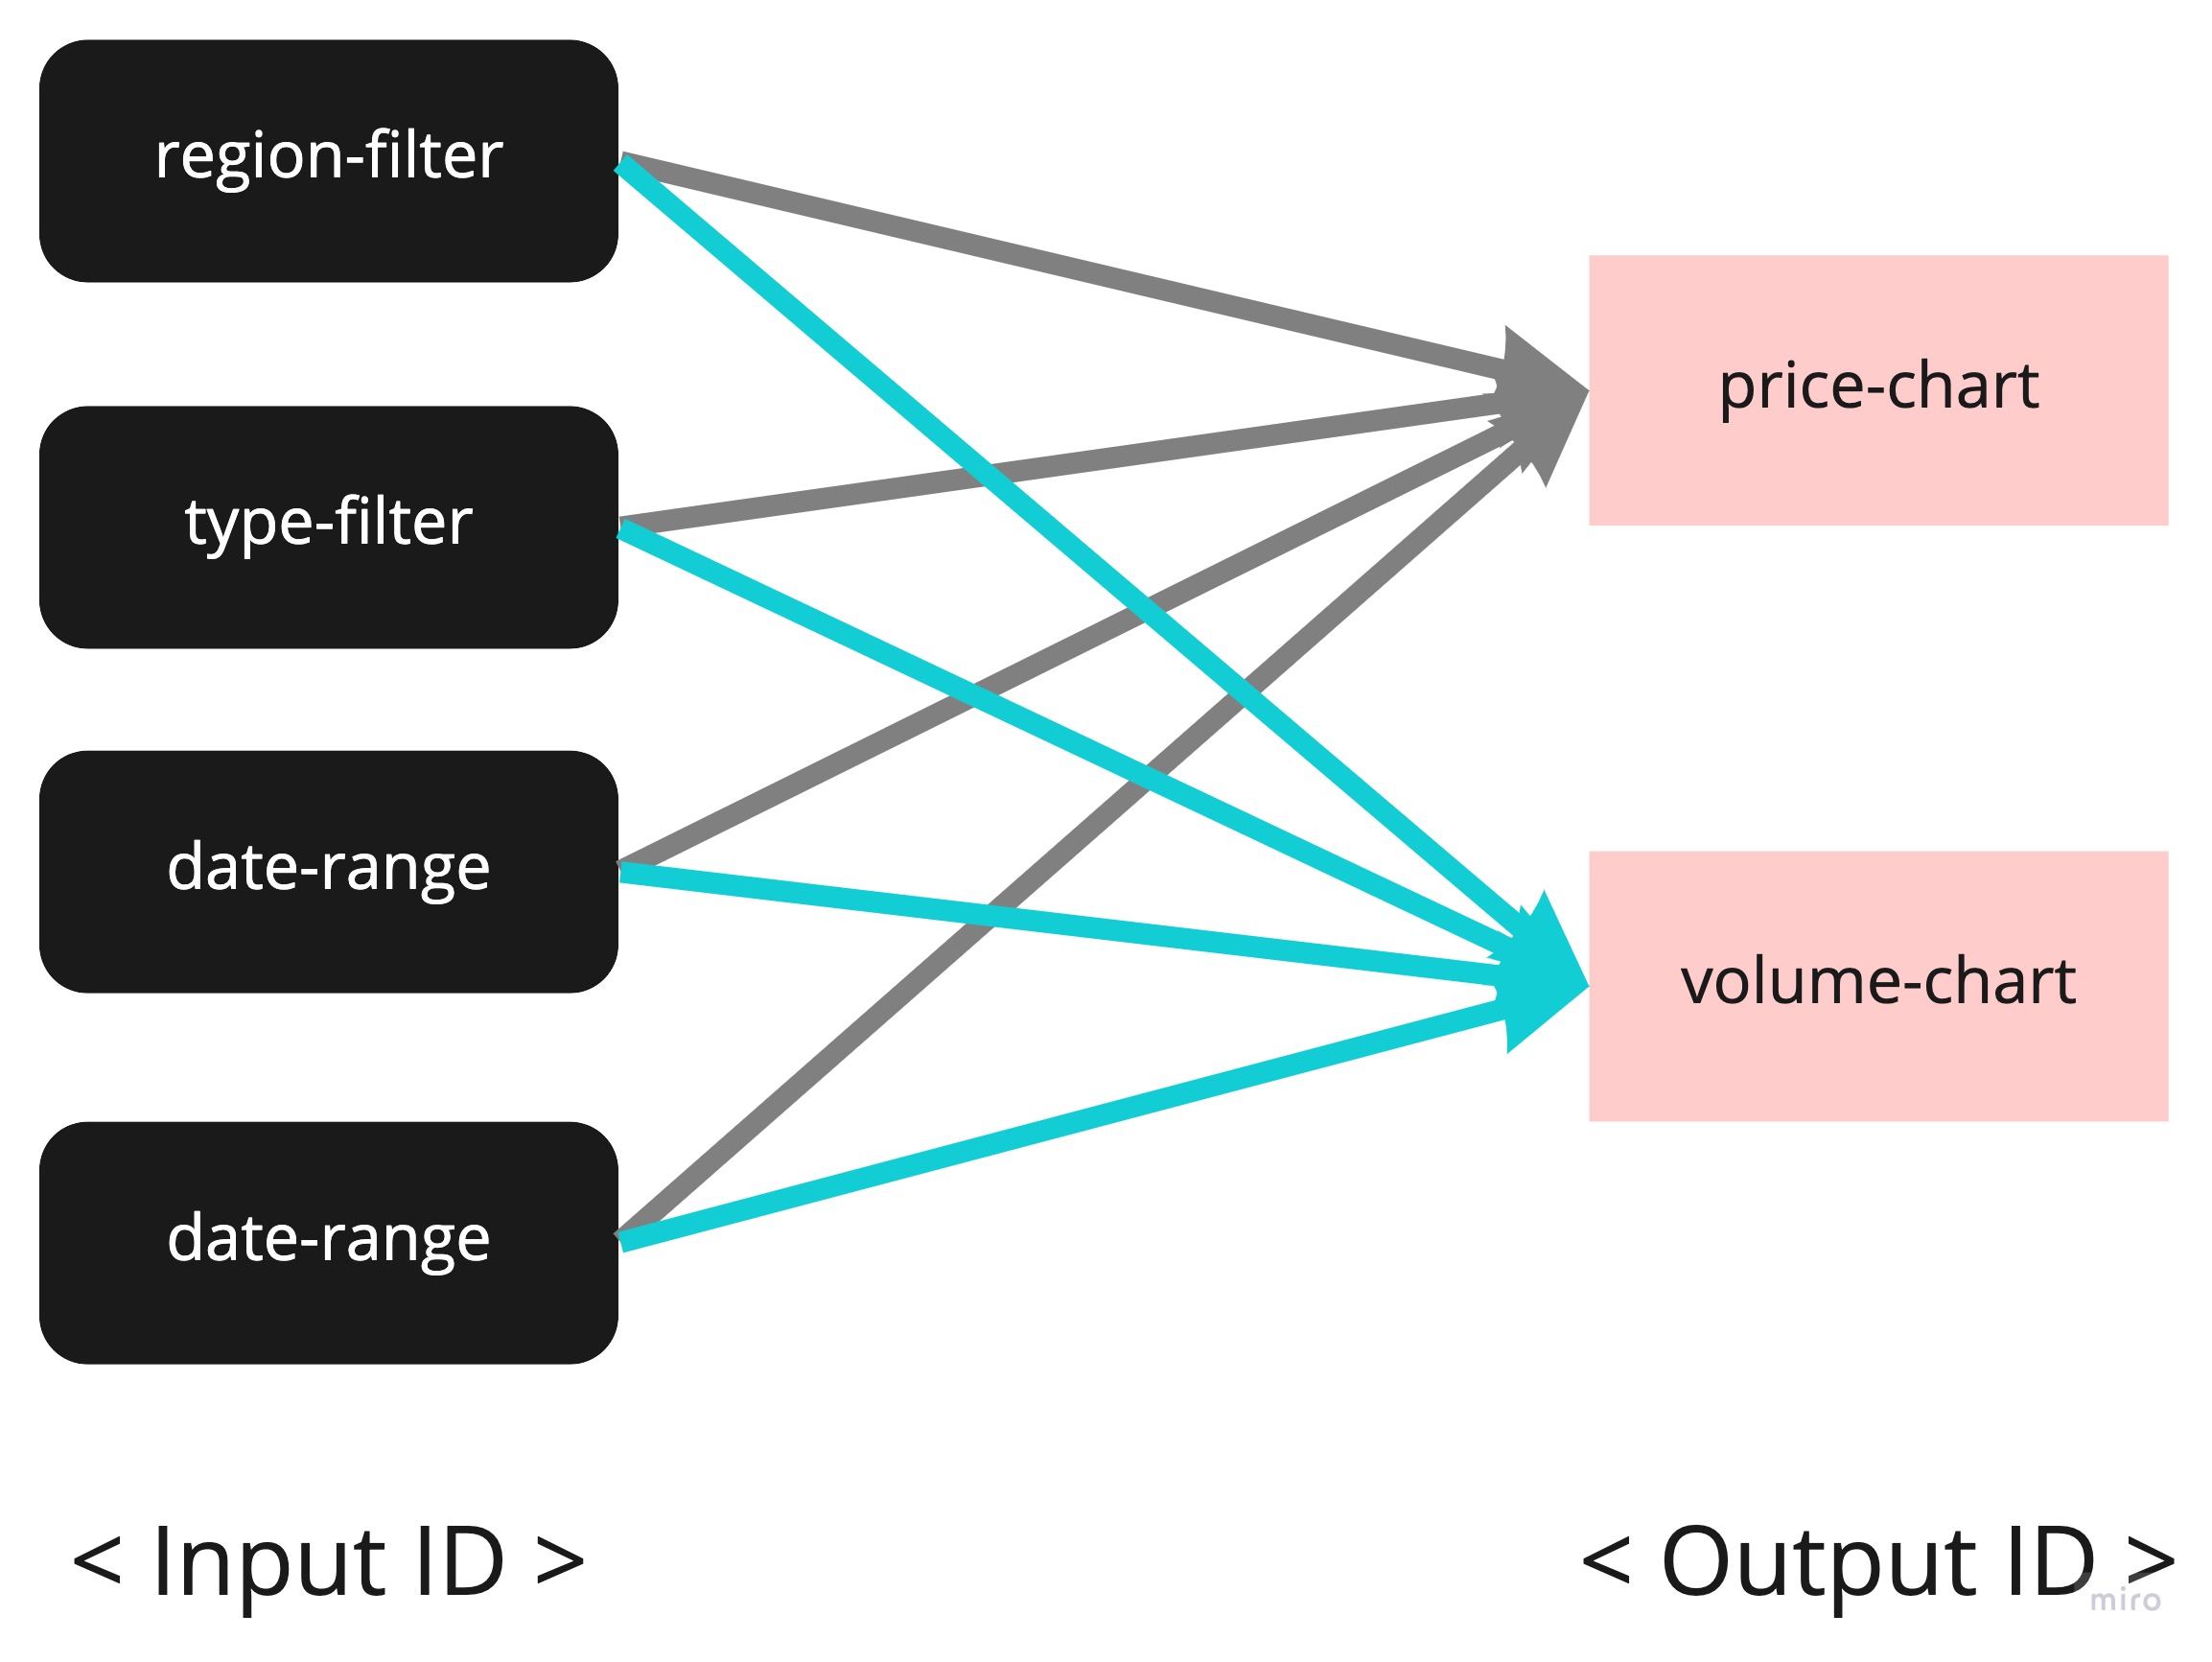
🧡 결과
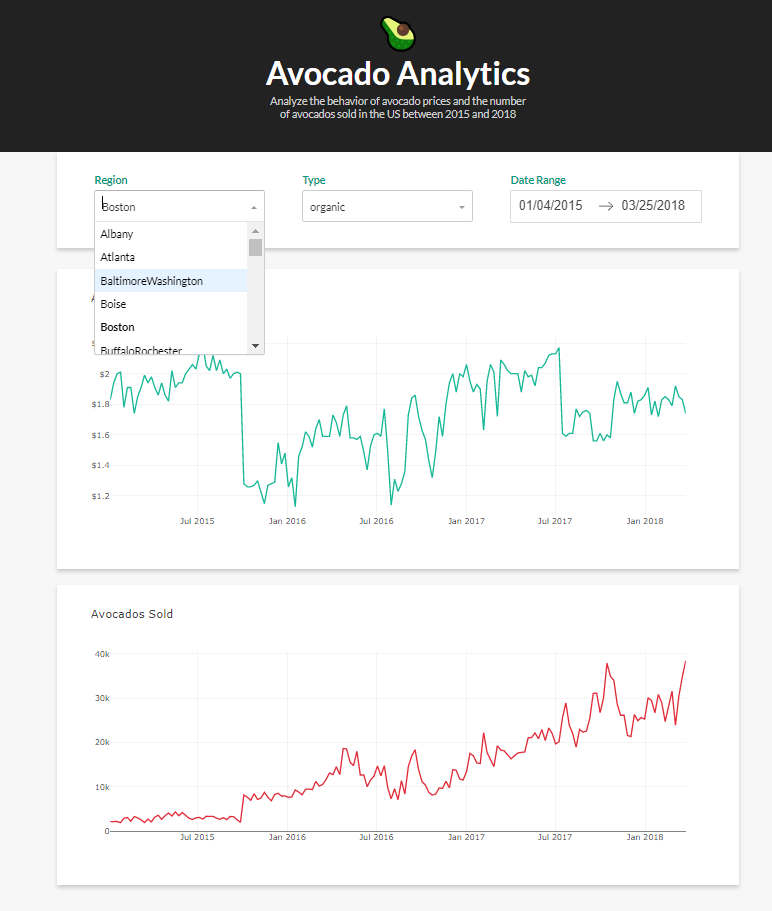
실시간으로 움직ㅇㅣ는 그래프도 해보고 싶다
'👩💻 인공지능 (ML & DL) > Serial Data' 카테고리의 다른 글
| 시계열 데이터(Serial data) 전처리 하기 (1) (0) | 2022.09.27 |
|---|---|
| 이상 탐지의 알고리즘 (Anomaly Detection Algorithm) (0) | 2022.09.27 |
| 시계열 데이터란(Time Serial) (2) | 2022.09.26 |
| Prophet을 이용한 기아 자동차 주가 예측하기 (1) | 2022.09.26 |
| [논문리뷰] Machine Learning for Anomaly Detection on VM and Host Performance Metrics (1) | 2022.09.26 |


