
😎 공부하는 징징알파카는 처음이지?
코로나 확진 예방을 위해 시계열(Time-Series) 데이터로 LSTM 예측 모델만들기 본문
👩💻 인공지능 (ML & DL)/Serial Data
코로나 확진 예방을 위해 시계열(Time-Series) 데이터로 LSTM 예측 모델만들기
징징알파카 2022. 10. 26. 14:46728x90
반응형
221026 작성
<본 블로그는 data-panic 님의 블로그를 참고해서 공부하며 작성하였습니다>
https://data-panic.tistory.com/33
🍓 코로나 확진 예방
- 해외유입확진자에 대한 시계열(Time-Series) 데이터를 사용하여 예측 모델 만들기
- 가까운 미래에 발생하는 해외유입 사례를 예측
- 14일의 미래값을 예측하는 것이 프로젝트의 목표
- 모델링에는 PyTorch 기반 LSTM 모델
🍓 코드 리뷰
1️⃣ Load libraries
import torch
import os
import numpy as np
import pandas as pd
from tqdm import tqdm
import seaborn as sns
from pylab import rcParams
import matplotlib.pyplot as plt
from matplotlib import rc
from sklearn.preprocessing import MinMaxScaler, StandardScaler
from sklearn.metrics import mean_squared_error
from pandas.plotting import register_matplotlib_converters
from torch import nn, optim

%matplotlib inline
%config InlineBackend.figure_format='retina'

sns.set(style='whitegrid', palette='muted', font_scale=1.2)

HAPPY_COLORS_PALETTE = ["#01BEFE", "#FFDD00", "#FF7D00", "#FF006D", "#93D30C", "#8F00FF"]

sns.set_palette(sns.color_palette(HAPPY_COLORS_PALETTE))

rcParams['figure.figsize'] = 14, 10
register_matplotlib_converters()

RANDOM_SEED = 42
np.random.seed(RANDOM_SEED)
torch.manual_seed(RANDOM_SEED)

import warnings
warnings.filterwarnings('ignore')

from matplotlib import font_manager, rc
2️⃣
df = pd.read_csv('final_0507.csv')
df.drop(["Unnamed: 0"], axis = 1, inplace = True)
df- date setting
df.Date = pd.to_datetime(df.Date)
df.set_index('Date', inplace=True)
df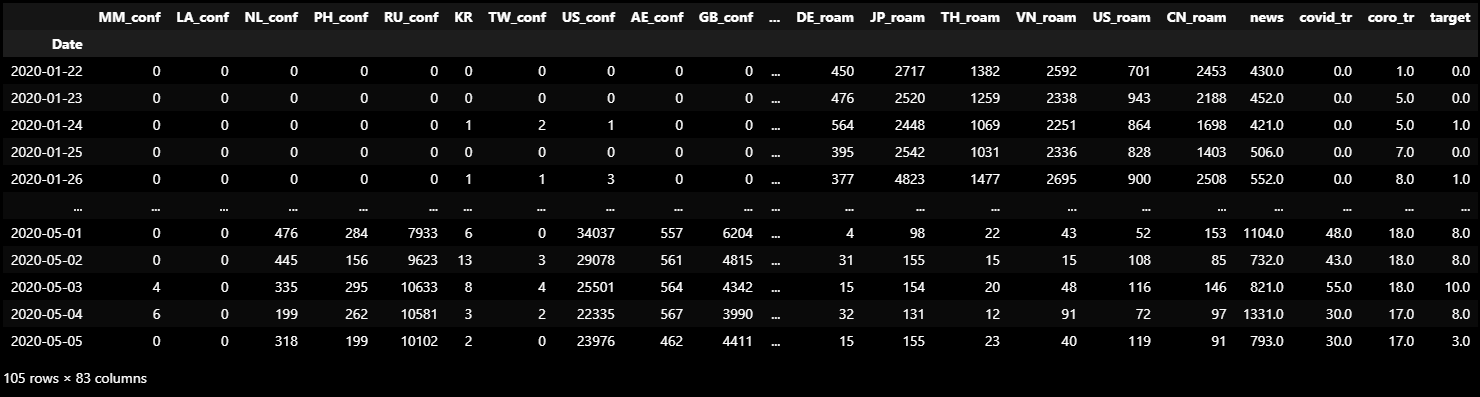
- 변수명
- Date : 날짜(index)
- 국가코드_conf : 해당 국가의 일별 확진자 수
- 국가코드_roam : 해당 국가로 부터 한국으로 들어온 일별 로밍 이용자 수
- KR : 국내 일별 확진자 수 (지역사회)
- news : 코로나 관련 해외 뉴스 일별 갯수
- covid_tr : 'covid' 키워드로 검색한 구글 트렌드 지수
- coro_tr : 'corona' 키워드로 검색한 구글 트렌드 지수
- target(해외유입확진자)
lag_col= list(df.columns)
lag_col
- 모든 변수에 시차(LAG) 생성
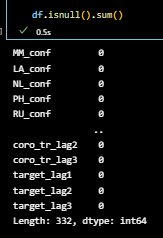
- 각 변수들에 3개의 시차 변수 만들고 생성으로 인한 NAN 값은 통째로 날리기
lag_amount = 3

for col in lag_col:
    for i in range(lag_amount):
        df['{0}_lag{1}'.format(col,i+1)] = df['{}'.format(col)].shift(i+1)

df.dropna(inplace=True)
df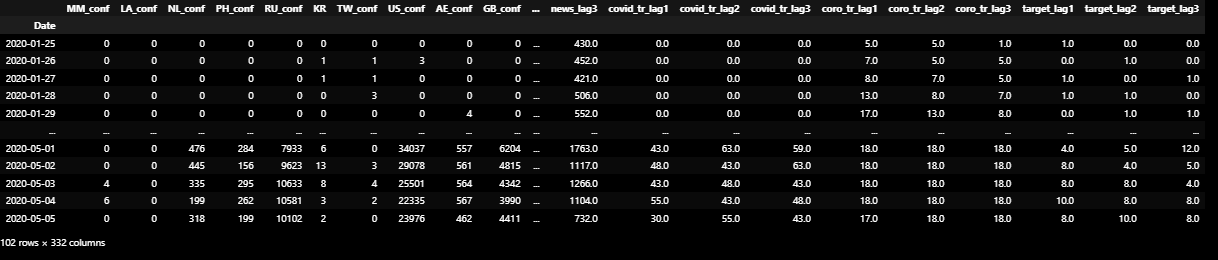
3️⃣ Data exploration
print("total shape: {}".format(df.shape))
print("target feature shape: {}".format(df['target'].shape))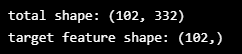
plt.figure(figsize=(25,5))
plt.plot(df['target'])
plt.xticks(rotation=90)
plt.title("Oversea Inflow Cofirmed")
plt.grid(axis='x')
4️⃣ LSTM 모델
X_cols = list(df.columns)
X_cols.remove('target')
- X, y에 스케일링
- Scikit-learn의 MinMaxScaler를 사용
- 스케일된 데이터를 추후에 다시 inverse scale 해주기 위해 X 데이터와 y데이터 각각 스케일러를 만들어 적용
- 그 후에 train / test 셋을 구분
- lstm sequence를 만들어주기 위해 y데이터를 flatten()하여 차원을 줄이기
# MinMaxScaler 스케일링
scaler = MinMaxScaler()

Xscaler = scaler.fit(X)
yscaler = scaler.fit(y.values.reshape(-1,1))
# 스케일링 적용
X = Xscaler.fit_transform(X)
y = yscaler.fit_transform(y.values.reshape(-1,1))# Train, Test set split
X_train, X_test = X[:-test_data_size], X[-test_data_size:]
y_train, y_test = y[:-test_data_size].flatten(), y[-test_data_size:].flatten()print("train set : ", X_train.shape)
print("test set : ", X_test.shape)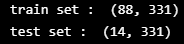
- LSTM 을 위한 시퀀스 데이터 형성 함수
- 모델 안에 들어갈 데이터를 시퀀스 형태로 만들어 주기 위한 함수
def create_sequences1(array, seq_length):
    res = []
    if seq_length == 1:
        for i in range(len(array)):
            tmp=array[i:(i+seq_length)]
            res.append(tmp)
    else:
        for i in range(len(array)-seq_length-1):
            tmp = array[i:(i+seq_length)]
            res.append(tmp)
    return res
✔ 함수를 사용하여 데이터를 시퀀스형태로 만듦
✔ 5개 씩 한 시퀀스로 묶었을 경우X_train을 보면 한 1개의 array에 5개의 데이터가 들어가 있음
= 1월 22일 부터 1월 26일까지의 X 데이터가 하나로 묶여서 모델로 들어가는 구조
✔ 시퀀스 형태로 만드는 이유는 시계열 데이터의 순서를 학습시키기 위함
seq_length = 5

X_train = create_sequences1(X_train, seq_length)
y_train = create_sequences1(y_train, seq_length)
X_test = create_sequences1(X_test, seq_length)
y_test = create_sequences1(y_test, seq_length)
X_train[:3]
-
시퀀스를 만들지 않고 사용하려면 seq_length를 1
-
목표했던 것은 14일 예측하는 것
-
시퀀스를 만듦으로써 데이터 또한 더 필요
-
가지고 있는 데이터는 한정되어있기 때문에 시퀀스를 만들지 않고 사용
-
seq_length = 1

X_train = create_sequences1(X_train, seq_length)
y_train = create_sequences1(y_train, seq_length)
X_test = create_sequences1(X_test, seq_length)
y_test = create_sequences1(y_test, seq_length)
X_train[:3]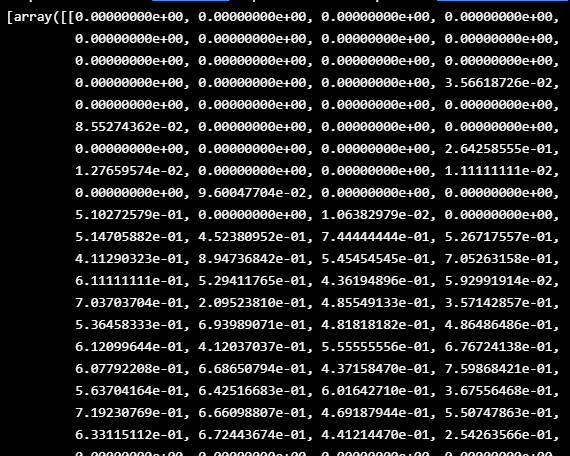
- PyTorch 모델에 데이터를 올리기 위해 torch.tensor로 변환
# numpy를 tensor로 변환
X_train = torch.tensor(X_train).float()
y_train = torch.tensor(y_train).float()
X_test = torch.tensor(X_test).float()
y_test = torch.tensor(y_test).float()
print("X_train :",(X_train.shape))
print("X_test :",(X_test.shape))
print("y_train :",(y_train.shape))
print("y_test :",(y_test.shape))
5️⃣ LSTM 모델 생성
- LSTM과 Linear로 구성
- num_layers로 레이어층의 갯수를 설정할 수 있도록 함
- 데이터가 적고 딥러닝 모델의 크거나 깊지 않으므로 dropout은 따로 주지 않음
# 모델 Clss 생성

class CoronaVirusPredictor(nn.Module):

    def __init__(self, n_features, n_hidden, seq_len, n_layers=2):
        super(CoronaVirusPredictor, self).__init__()
        self.n_hidden = n_hidden
        self.seq_len = seq_len
        self.n_layers = n_layers

        self.lstm = nn.LSTM(
        input_size = n_features,
        hidden_size = n_hidden,
        num_layers = n_layers,
        #dropout=0.1
        )

        self.linear = nn.Linear(in_features=n_hidden, out_features=1)

    def reset_hidden_state(self):
            self.hidden = (
                torch.zeros(self.n_layers, self.seq_len, self.n_hidden),
                torch.zeros(self.n_layers, self.seq_len, self.n_hidden))

    def forward(self, sequences):
        lstm_out, self.hidden = self.lstm(sequences.view(len(sequences), self.seq_len, -1), self.hidden)
        last_time_step = lstm_out.view(self.seq_len, len(sequences), self.n_hidden)[-1]
        y_pred = self.linear(last_time_step)

        return y_pred
6️⃣ 모델 훈련
- epoch과 learning rate를 파라미터로 설정할 수 있게 함
- loss function으로는 MSELoss
- optimizer로 Adam
- optimizer에 weight_decay를 설정
- 10 epoch 마다 train과 test의 loss를 출력
def train_model(model, train_data, train_labels, test_data=None, test_labels=None, num_epochs=250, lr=1e-3):
    loss_fn = torch.nn.MSELoss()

    optimiser = torch.optim.Adam(model.parameters(), lr=lr, weight_decay=1e-4)
    num_epochs = num_epochs

    train_hist = np.zeros(num_epochs)
    test_hist = np.zeros(num_epochs)

    for t in range(num_epochs):
        model.reset_hidden_state()
        y_pred = model(X_train)
        loss = loss_fn(y_pred.float(), y_train)

        if test_data is not None:
            with torch.no_grad():
                y_test_pred = model(X_test)
                test_loss = loss_fn(y_test_pred.float(), y_test)
            test_hist[t] = test_loss.item()

            if t % 10 == 0:
                print(f'Epoch {t} train loss: {round(loss.item(),4)} test loss: {round(test_loss.item(),4)}')
        elif t % 10 == 0:
            print(f'Epoch {t} train loss: {loss.item()}')

        train_hist[t] = loss.item()
        optimiser.zero_grad()
        loss.backward()
        optimiser.step()

    return model.eval(), train_hist, test_hist
# 하이퍼파라미터
n_features=X_train.shape[-1]
n_hidden=64
n_layers=4
lr=1e-4
num_epochs=200# Training Model
model = CoronaVirusPredictor(n_features=n_features, n_hidden=n_hidden, seq_len=seq_length, n_layers=n_layers)
model, train_hist, test_hist = train_model(model, X_train, y_train, X_test, y_test, num_epochs=num_epochs, lr=lr)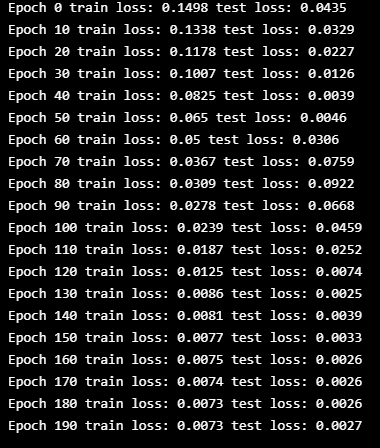
-
학습 결과
-
loss가 수렴하는 모습을 보면 상당히 비정상적인 것
-
우선 train보다 test의 loss가 더 낮음
-
1) train data가 너무 어렵거나 test data가 너무 쉬울 경우에 train loss 보다 test loss가 낮게 나올 수 있음
-
2) 100여개 정도의 데이터를 가지고 딥러닝 모델을 돌렸으니 사실 정상적인 학습은 아님 -> 데이터의 수가 너무 적음
-
-
# plotting Loss
plt.plot(train_hist, label="Training loss")
plt.plot(test_hist, label="Test loss")
plt.title('n_features:{0}, n_hidden:{1}, n_layers:{2}, lr:{3}, seq_length:{4}, num_epochs:{5}'.format(n_features,n_hidden,n_layers,lr,seq_length,num_epochs))
plt.legend()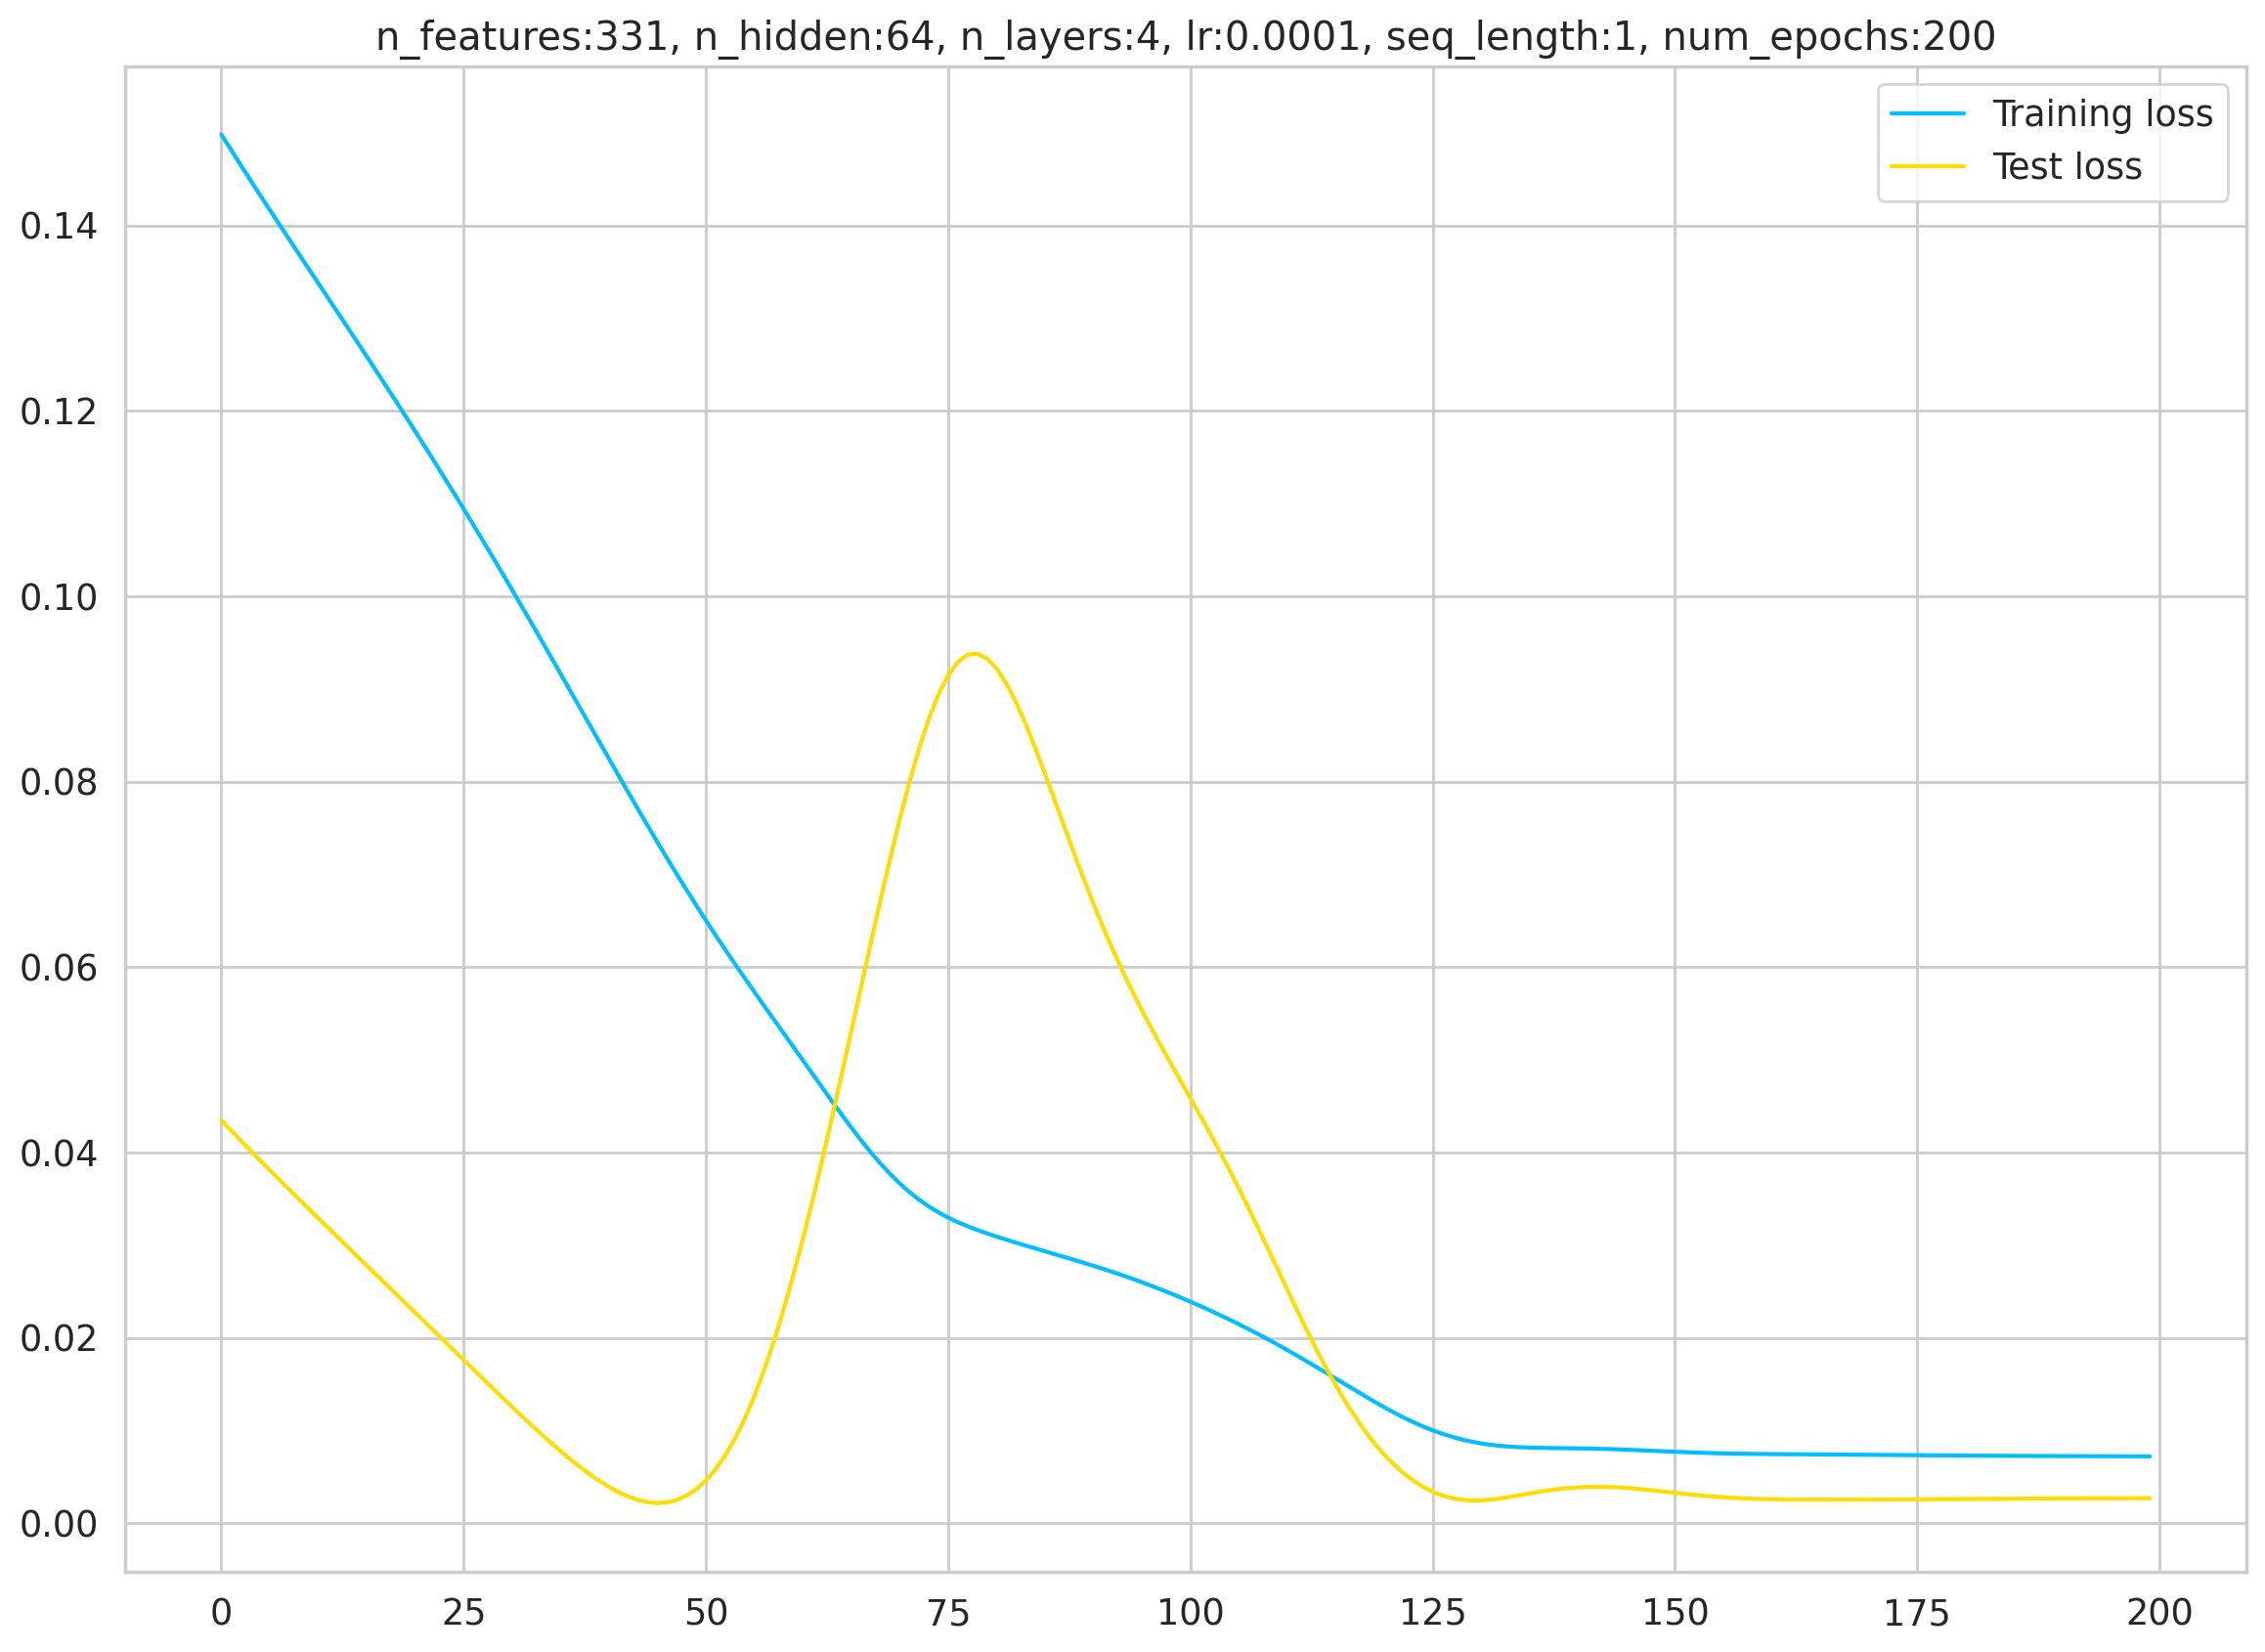
7️⃣ 일일 케이스 예측
with torch.no_grad():

    preds = []
    for i in range(len(X_test)):
        test_seq = X_test[i:i+1]
        y_test_pred = model(test_seq)
        pred = torch.flatten(y_test_pred).item()
        preds.append(pred)
        new_seq = test_seq.numpy().flatten()
        new_seq = np.append(new_seq, pred)
        new_seq = new_seq[1:]
        test_seq = torch.as_tensor(new_seq).view(n_features, seq_length, 1).float()
-
X_test 값을 모델에 넣어 예측값 preds를 산출
-
소수점의 결과값들이 나오는데 이건 위에서 데이터를 스케일링 해줬기 때문
# Prediction value 역변환
pred_values = yscaler.inverse_transform(np.array(preds).reshape(-1,1))
- X_test 값을 모델에 넣어 예측값 pr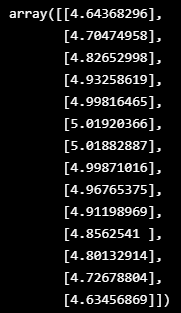
- 소수점의 결과값들이 나오는데 이건 위에서 데이터를 스케일링 해줬기 때문
pred_values_ceiled = list(pred_values.flatten())# True value 역변환
true_values = yscaler.inverse_transform(y_test)[:, [-1]]# 실제값 예측과 데이터 프레임 생성
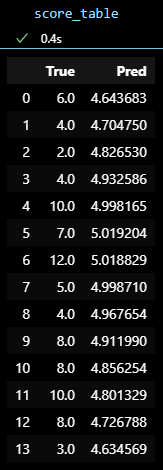
score_table = pd.DataFrame({'True':true_values.flatten(),
'Pred':pred_values_ceiled})
-
실제 y값 'True'와 모델로 부터 나온 예측값 'Pred'로 구성된 score_table
-
4월 22일 부터 5월5일까지의 실제값과 예측값
- MSE와 RMSE를 생성
- score는 실제값과 예측값의 차이가 작을 수록 100에 가까워지는 점수
# validation score
MSE = mean_squared_error(score_table['True'], score_table['Pred'])
RMSE = np.sqrt(MSE)
score = 100*(1-(((score_table['Pred'] -score_table['True'])**2).sum())/((score_table['True']**2).sum()))
print("MSE : {0}, RMSE : {1}, SCORE : {2}".format(MSE, RMSE, score))
- 노란선이 실제값이고 빨간선이 예측값
- 실제 해외유입확진자의 경우에는 일일별 굴곡들이 있음
plt.figure(figsize=(10,5))
plt.plot(range(y_train.__len__()),yscaler.inverse_transform(y_train)[:, [-1]])
plt.plot(range(y_train.__len__(), y_train.__len__()+y_test.__len__()),true_values, label='Real')
plt.plot(range(y_train.__len__(), y_train.__len__()+y_test.__len__()),pred_values_ceiled, label='Pred')
#plt.xlim(70)
plt.legend()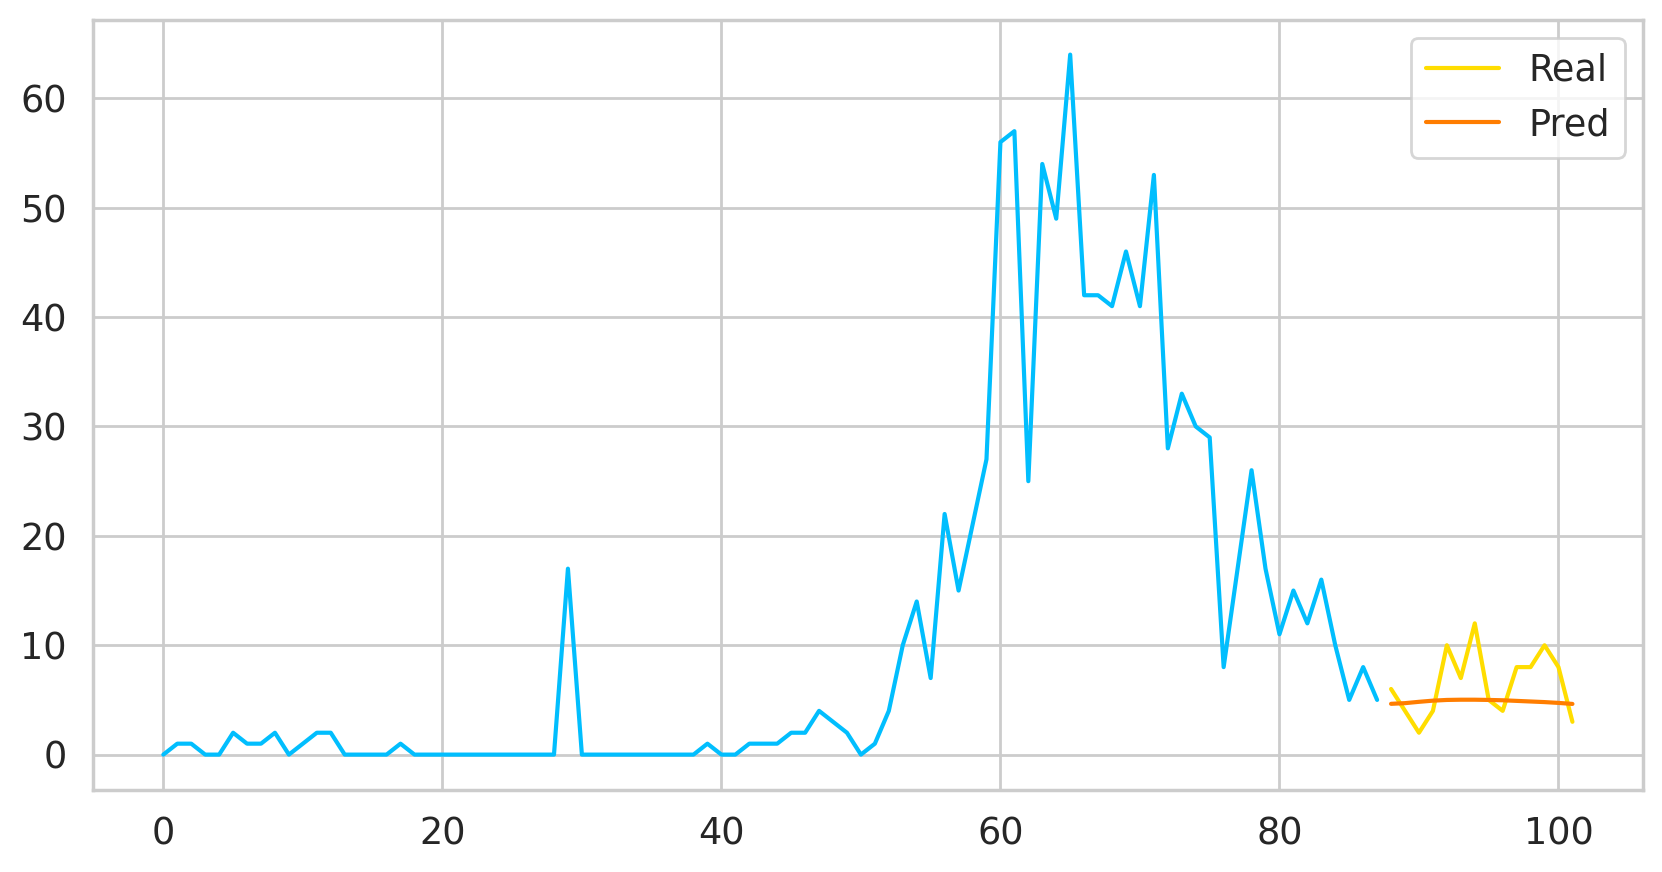
- PyTorch의 모델 확장자 형식인 .pth로 저장
- 모델의 파일명은 사용한 파라미터와 점수를 넣어 어떤 모델이었는지 구분 가능
# 모델 저장
PATH = './{6}_n_features_{0}_n_hidden_{1}_n_layers_{2}_lr_{3}_seq_length_{4}_num_epochs_{5}.pth'.format(n_features,n_hidden,n_layers,lr,seq_length,num_epochs, score.round(2))

torch.save(model, PATH)
8️⃣ 전체 데이터를 사용하여 미래 예측
- 동일하게 데이터를 전처리
- Train, Test를 나누는 것이 아닌 전체 데이터를 사용
X_all = df[X_cols]
y_all = df['target']
# MinMaxScaler 스케일링
scaler = MinMaxScaler()
# X scaler
Xscaler = scaler.fit(X_all)
# Y scaler
yscaler = scaler.fit(y_all.values.reshape(-1,1))
# 스케일링 적용
X_all = Xscaler.fit_transform(X_all)
y_all = yscaler.fit_transform(y_all.values.reshape(-1,1))
y_all = y_all.flatten()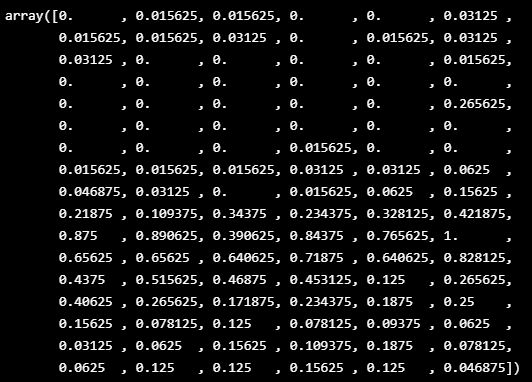
print("X_all : ", X_all.shape)
print("y_all : ", y_all.shape)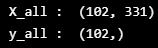
X_all = create_sequences1(X_all, seq_length)
y_all = create_sequences1(y_all, seq_length)
X_all = torch.from_numpy(np.array(X_all)).float()
y_all = torch.from_numpy(np.array(y_all)).float()
- DAYS_TO_PREDICT는 예측할 날짜의 수
- 14일을 예측하는 것이 목표였기 때문에 14로 설정
DAYS_TO_PREDICT = 14

with torch.no_grad():
    test_seq = X_all[:1]
    preds = []
    for _ in range(DAYS_TO_PREDICT):
        y_test_pred = model(test_seq)
        pred = torch.flatten(y_test_pred).item()
        preds.append(pred)
        new_seq = test_seq.numpy().flatten()
        new_seq = np.append(new_seq, [pred])
        new_seq = new_seq[1:]
pred_values = yscaler.inverse_transform(np.array(preds).reshape(-1,1))
- 14일 치의 미래 예측값
- 4명에서 1명까지 떨어짐
- 모델이 실제로 해외유입확진자의 감소를 학습을 한건지 아니면 딱히 예측에 대한 근거나 힘이 없어서 떨어질거라고 예측한건지는 알 수가 없음
import math

pred_values_ceiled = list(pred_values.flatten())
predicted_cases=pred_values_ceiled
predicted_cases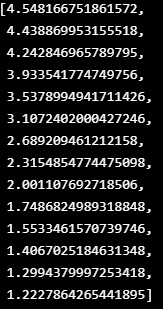
predicted_index = pd.date_range(
  start=df.index[-1],
  periods=DAYS_TO_PREDICT + 1,
  closed='right'
)
predicted_index = pd.to_datetime(predicted_index, format='%Y%m%d')

predicted_cases = pd.Series(
  data=predicted_cases,
  index=predicted_index
)

plt.plot(predicted_cases, label='Predicted Daily Cases')
plt.legend();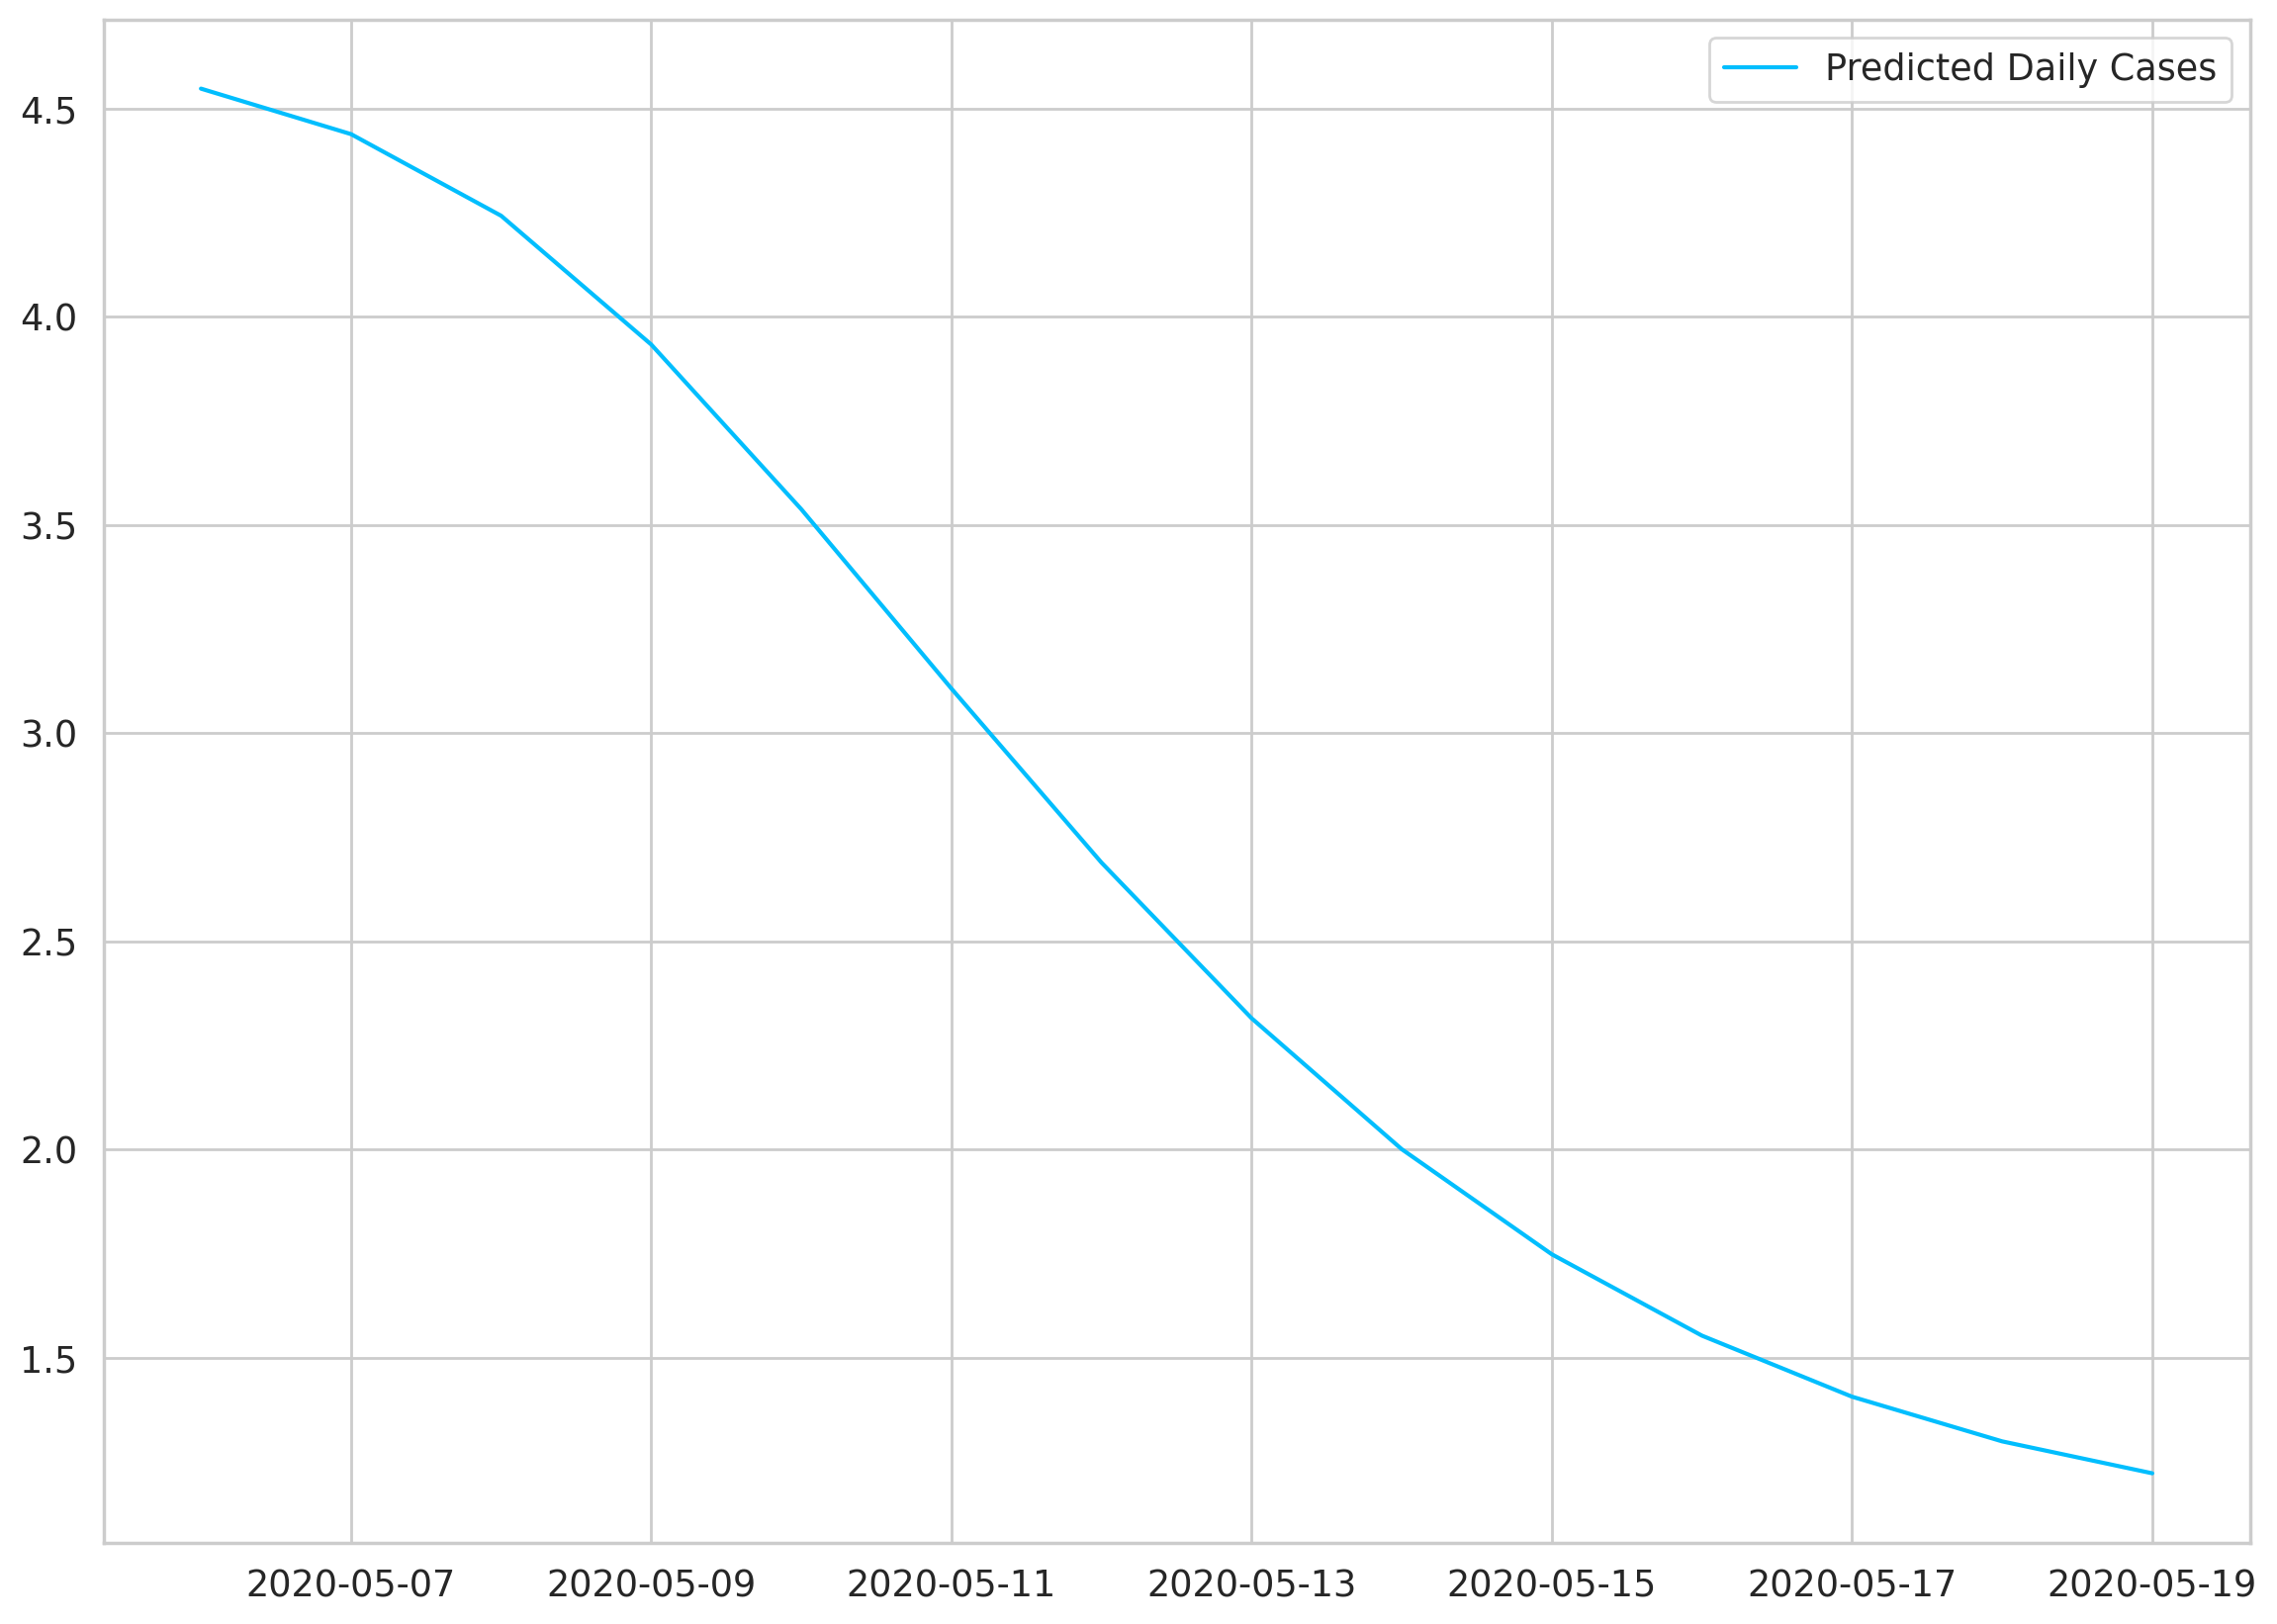

preds_ = pd.DataFrame(predicted_cases)
df.index = pd.to_datetime(df.index)
plt.figure(figsize=(25,5))
plt.plot(df['target'].astype(int), label='Historical Daily Cases')
plt.plot(preds_, label='Predicted Daily Cases')
plt.xticks(rotation=90)
plt.title("Oversea Inflow Cofirmed")
plt.grid(axis='x')
plt.legend()
728x90
반응형
'👩💻 인공지능 (ML & DL) > Serial Data' 카테고리의 다른 글
| CNN-LSTM 으로 시계열 분석하기 (0) | 2022.11.04 |
|---|---|
| Serial Data 장애 예측/감지 LSTM & Conv 모델 (0) | 2022.10.28 |
| [FuncAnimation] 4. Mongo DB에 시계열 데이터 저장하기 (2) (0) | 2022.10.25 |
| [FuncAnimation] 3. Mongo DB에 시계열 데이터 저장하기 (1) (0) | 2022.10.24 |
| [FuncAnimation] 2. 단일변량 그래프를 만들어서 GUI로 시각화하기 (0) | 2022.10.24 |
'👩💻 인공지능 (ML & DL)/Serial Data' Related Articles
more


Comments