
😎 공부하는 징징알파카는 처음이지?
HTML에서 Python을 사용할 수 있는 PyScript (11) 본문
728x90
반응형
<본 블로그는 itadventrue 님의 블로그를 참고해서 공부하며 작성하였습니다 :-)>
https://itadventure.tistory.com/553
파도!(12) - 무신 러닝? 머신러닝! - 리니어 리그레션 ( LinearRegression )
'파도'는 파이스크립트 도전기의 줄임말입니다. 지난 게시글까지는 파이스크립트에서 csv 로 된 데이터를 불러와 그래프로 표현하는 것이 중점적인 내용이었지요. https://itadventure.tistory.com/552 파
itadventure.tistory.com
🎄 파이스크립트에서 머신러닝을 처리
❗ 머신 러닝은 기계(머신:Machine) 학습(러닝:Learning)
파이썬에서 사용할 수 있는 여러 인공지능 관련 기술을 무료 공개 -> 싸이킷-런 라이브러리
<py-env>
  - pandas
  - matplotlib
  - seaborn
  - scikit-learn
 </pv-env>
❗ 리니어 리그레션(Linear Regression)
'선형회귀모델'을 선언
from sklearn.linear_model import LinearRegression
선형회귀모델 = LinearRegression()
❗ 기계 학습 방법
머신러닝이 예측할 결과를 정함
머신러닝이 매출량을 예측하는 것을 목표
데이터를 나누어서 제공
훈련용데이터 : 연도, 월, 일, 주(1년중 몇번째 주인지)
훈련용목표 : 매출량
훈련
선형회귀모델.fit(훈련용데이터, 훈련용목표)
모델의 예측
선형회귀 모델은 다른 주어진 데이터를 바탕으로 결과를 예측
연도, 월, 일, 주 단위의 데이터를 테스트데이터로 제공하면 매출량 결과를 예측
테스트목표예측 = 선형회귀모델.predict(테스트데이터)그래프로 시각화
🎄 매출량 예측 그래프
❗ 코드 구현
- index.html
<html>
<head>
<link rel="stylesheet"
href="https://pyscript.net/alpha/pyscript.css" />
<script defer
src="https://pyscript.net/alpha/pyscript.js"></script>
<py-env>
- pandas
- matplotlib
- seaborn
- scikit-learn
- paths :
- ./common.py
</py-env>
</head>
<body>
<link rel="stylesheet" href="pytable.css"/>
<py-script>
import pandas as pd
from pyodide.http import open_url
from common import *
import numpy as np
from datetime import datetime
<!-- 경고 문구 제거 -->
import warnings
warnings.filterwarnings( 'ignore' )
<!-- 판다스에서 csv 를 데이터 프레임으로 읽어옴 -->
SalesData = pd.read_csv(open_url(
"http://dreamplan7.cafe24.com/pyscript/csv/avocado.csv"
))
<!-- # 2개 필드만 추려서 데이터 프레임을 다시 만듬 -->
SalesData = SalesData[[
'Date',
'Total Volume'
]]
SalesData.columns = [
'Day',
'Amount'
]
<!-- 주간 매출량 그룹 -->
WeekdaysSalesData = SalesData.fillna(0) \
.groupby('Day', as_index=False)[['Amount']] \
.sum() \
.sort_values(
by='Day',
ascending=True
)
<!-- 날짜(시간값) 추가 -->
WeekdaysSalesData.insert(1, 'Day(timeValue)',
'',
True)
for i in WeekdaysSalesData['Day'].index:
WeekdaysSalesData['Day(timeValue)'].loc[i]=time.mktime(
datetime.strptime(
WeekdaysSalesData['Day'].loc[i],
'%Y-%m-%d'
).timetuple()
)
<!-- 10000으로 나눈 매출량 필드 추가 -->
WeekdaysSalesData.insert(2, 'Amount(10000)',
WeekdaysSalesData['Amount']/10000,
True)
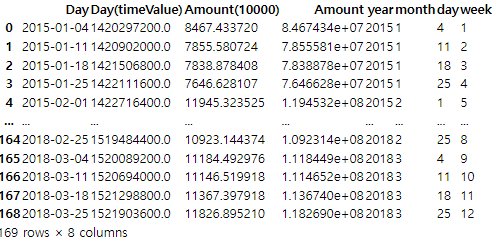
<!-- 훈련학습용으로 날짜를 연도, 월, 일로 나눈다 -->
WeekdaysSalesData.insert(4, 'year', '', True)
WeekdaysSalesData.insert(5, 'month', '', True)
WeekdaysSalesData.insert(6, 'day', '', True)
WeekdaysSalesData.insert(7, 'week', '', True)
for i in WeekdaysSalesData['Day'].index:
temp = str(WeekdaysSalesData['Day'].loc[i]).split('-')
year = int(temp[0])
month = int(temp[1])
day = int(temp[2])
WeekdaysSalesData['year'].loc[i] = year
WeekdaysSalesData['month'].loc[i] = month
WeekdaysSalesData['day'].loc[i] = day
WeekdaysSalesData['week'].loc[i] = str(
datetime(year, month, day).isocalendar()[1]
)
createElementDiv(
document,
Element,
'output2'
).write(WeekdaysSalesData)
WeekdaysSalesDataTrain_numpy = WeekdaysSalesData[['Day(timeValue)', 'year', 'month', 'day', 'week']].to_numpy()
WeekdaysSalesDataTest_numpy = WeekdaysSalesData['Amount(10000)'].to_numpy()
from sklearn.model_selection import train_test_split
X_train, X_test, y_train, y_test = \
train_test_split(
WeekdaysSalesDataTrain_numpy,
WeekdaysSalesDataTest_numpy,
random_state=100,
shuffle=False)
<!-- 선형 회귀 알고리즘 -->
<!-- 훈련, 최적의 그래프를 찾아준다 -->
from sklearn.linear_model import LinearRegression
lr = LinearRegression()
lr.fit(X_train, y_train)
y_train_predict = lr.predict(X_train)
y_test_predict = lr.predict(X_test)
import matplotlib.pyplot as plt
import matplotlib as mat
<!-- 그래프 -->
fig = plt.figure(
figsize=(15, 7)
)
plt.xticks(WeekdaysSalesData['Day(timeValue)'].to_numpy(), WeekdaysSalesData[['Day']].to_numpy()[:,0], rotation=90)
plt.title('Weekdays Avocado SalesAmount')
plt.plot(
X_train[:,0],
y_train,
marker='o',
color='#c14549',
label='Original'
)
plt.plot(
X_train[:,0],
y_train_predict,
marker='d',
color='blue',
label='Train pattern'
)
plt.plot(
X_test[:, 0],
y_test,
marker='o',
color='#c14549'
)
plt.plot(
X_test[:, 0],
y_test_predict,
marker='d',
color='green',
label='Predict pattern'
)
plt.xlabel('Day')
plt.ylabel('Day(timeValue)')
plt.legend(
shadow=True
)
ax = plt.gca()
<!-- 축만 그리드 -->
ax.xaxis.grid(True)
<!-- 배경색, 마진 조정 -->
ax.set_facecolor('#e8e7d2')
ax.margins(x=0.01, y=0.02)
<!-- 주위 이상한 여백 없애기 -->
fig.tight_layout()
fig
</py-script>
</body>
</html>
- common.py
def createElementDiv(document, Element, name):
    element = document.createElement('div')
    element.id = name
    document.body.append(element)
    return Element(name)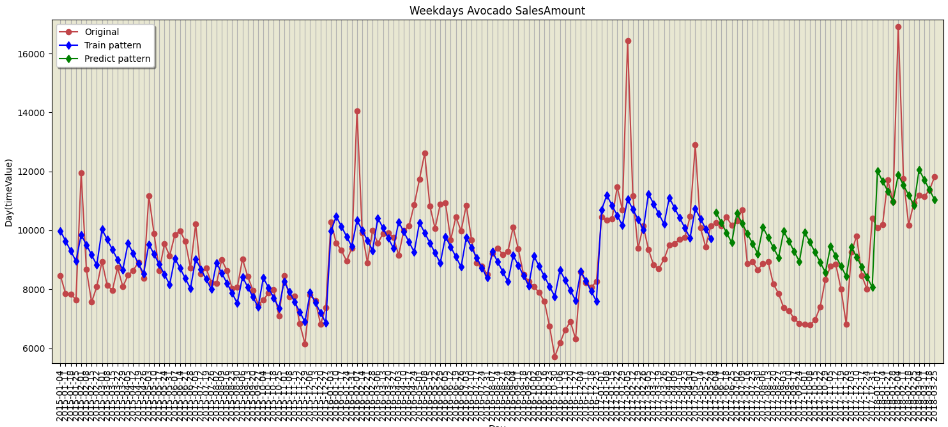
나는 한글 안해서
영어로 바꾸느라 힘들어따~~~ ㅋㅋㅋ
728x90
반응형
'👩💻 백엔드(Back-End) > Node js' 카테고리의 다른 글
| HTML에서 Python을 사용할 수 있는 PyScript (13) (1) | 2022.11.28 |
|---|---|
| HTML에서 Python을 사용할 수 있는 PyScript (12) (0) | 2022.11.28 |
| HTML에서 Python을 사용할 수 있는 PyScript (10) (1) | 2022.11.25 |
| HTML에서 Python을 사용할 수 있는 PyScript (9) (1) | 2022.11.25 |
| HTML에서 Python을 사용할 수 있는 PyScript (8) (0) | 2022.11.25 |
'👩💻 백엔드(Back-End)/Node js' Related Articles
more


Comments