
😎 공부하는 징징알파카는 처음이지?
[FuncAnimation] 1. Random 데이터로 실시간 그래프 만들기 본문
728x90
반응형
221021 작성
<본 블로그는 redorangeyellowy님의 블로그를 참고해서 공부하며 작성하였습니다>
https://operstu1.tistory.com/97
<matplotlib> 실시간 데이터 반영 그래프
<목차> 1. 기본 구조 2. csv 파일 읽어들여 만들기 1. 기본 구조 사용한 라이브러리 random -> 무작위의 수를 생성하기 위해 사용합니다. intertools.count -> 1,2,3... 순차적인 수를 생성하기 위해 사용합니
operstu1.tistory.com
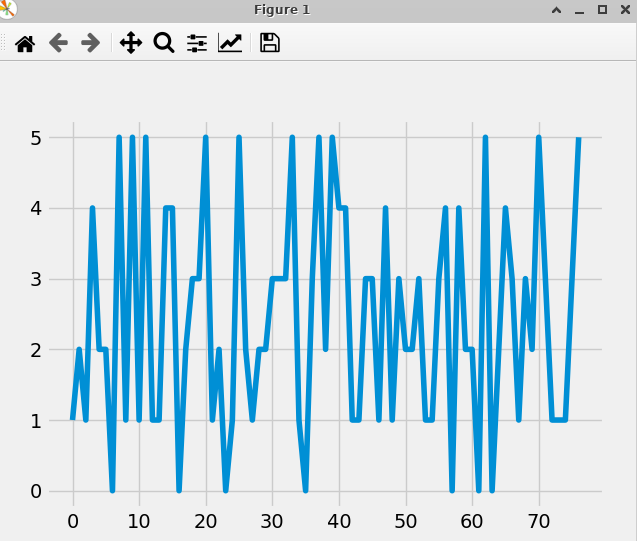
💎 무작위 수를 생성해서 실시간 그래프 만들기 1
anim = FuncAnimation(fig, animate, frames=200, interval=50)- Figure 객체
- 프레임마다 반복해서 호출할 함수
- 반복 가능한 객체를 입력
- 프레임 간격
# random 데이터
import random                       # 무작위의 수를 생성
from itertools import count         # 1,2,3... 순차적인 수를 생성
import pandas as pd
# animation 효과, 실시간 데이터 반영
import matplotlib.pyplot as plt
from matplotlib.animation import FuncAnimation

plt.style.use('fivethirtyeight')

x_val = []
y_val = []

index = count()

def animate(i):
    x_val.append(next(index))                   # 순차적인 수를 생성
    y_val.append(random.randint(0,5))           # 0~5 사이의 랜덤한 정수를 생성
    plt.cla()                                   # 앞선 그래프를 삭제
    plt.plot(x_val, y_val)

ani = FuncAnimation(plt.gcf(), animate, interval = 1000)
# plt.gcf() : 현재 그래프 모양을 가져오기
# animate : 애니메이션 효과를 적용
# interval : 1000 -> 1000 밀리초 마다 적용


plt.tight_layout()          # 자동으로 명시된 여백에 관련된 서브플롯 파라미터 조정
plt.show()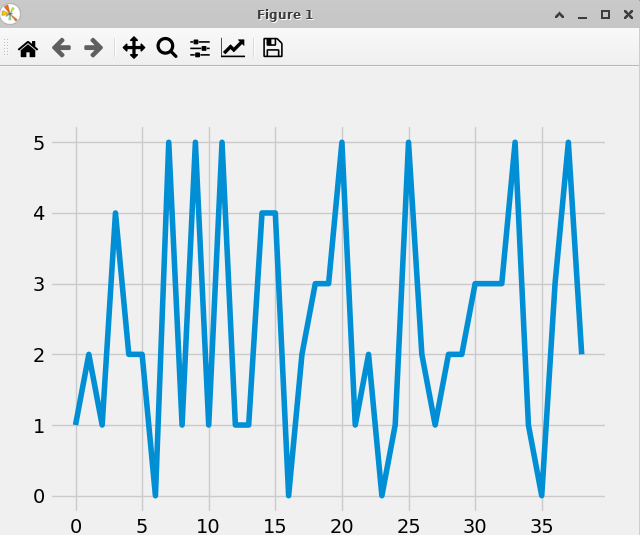
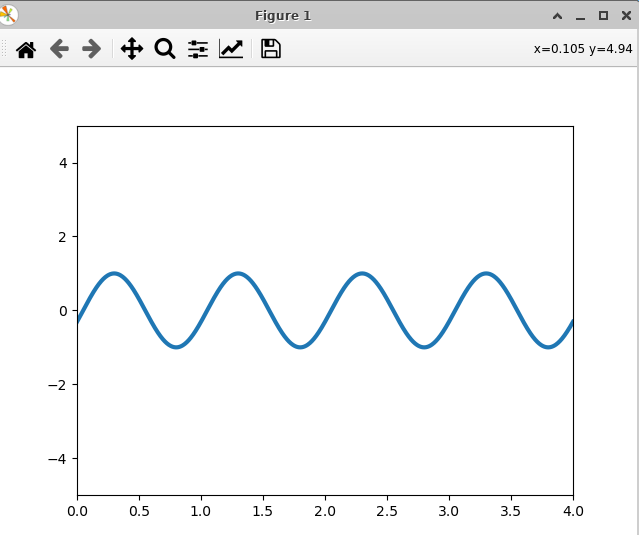
💎 무작위 수를 생성해서 실시간 그래프 만들기 2
import numpy as np
import matplotlib.pyplot as plt
from matplotlib.animation import FuncAnimation

fig = plt.figure()
ax = plt.axes(xlim=(0, 4), ylim=(-5, 5))
line, = ax.plot([], [], lw=3)


def animate(i):
  x = np.linspace(0, 4, 1000)
  y = np.sin(2 * np.pi * (x - 0.05 * i))
  line.set_data(x, y)
  return line,


# anim = FuncAnimation(fig, animate, frames=200, interval=50)
anim = FuncAnimation(fig, animate, frames=100, interval=50)

plt.show()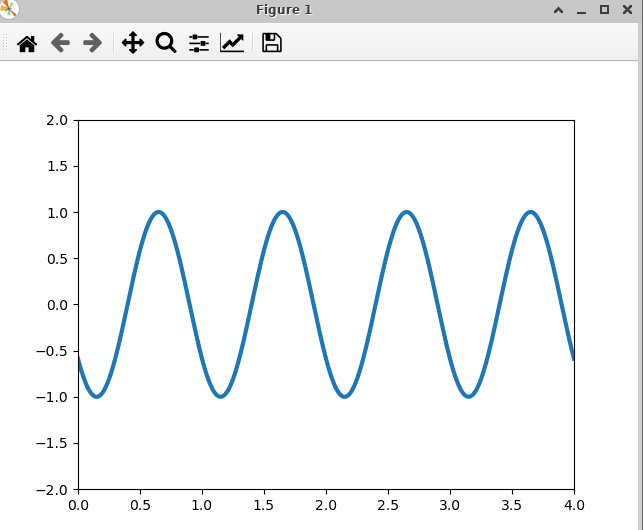
💎 csv파일 로드해서 실시간 그래프 만들기
import random
from itertools import count
import pandas as pd
import matplotlib.pyplot as plt
from matplotlib.animation import FuncAnimation
from pandas.core.indexes import interval


def load_file(data)  :
    df = pd.concat([data['insert_date_time'][:20000], data['cnt_mt1'][:20000]], axis = 1)
    print(df)
    return df

fig = plt.figure()
ax = plt.axes(xlim=(0, 10), ylim=(-10, 500))
line, = ax.plot([], [], lw=3)

def animate(i):
    temp = pd.read_csv("/home/ubuntu/FPDS/20220929/sendinginfo_20220929.csv")
    data = load_file(temp)
    print(data.columns)
    # data =pd.read_csv('data4.csv')
    x = data['insert_date_time']
    y1 = data['cnt_mt1']
    # y2 = data['total_2']

    plt.cla()
    plt.plot(x,y1, label='insert_date_time')
    line.set_data(x, y1)

    return line,

# ani = FuncAnimation(plt.gcf(), animate, interval = 10)
ani = FuncAnimation(fig, animate, interval = 10)
# anim = FuncAnimation(fig, animate, frames=200, interval=50)
# (Figure 객체, 프레임마다 반복해서 호출할 함수, 반복 가능한 객체를 입력, 프레임 간격)

plt.tight_layout()
plt.show()


# gif 저장하기
#graph_ani.save('graph_ani.gif', writer='imagemagick', fps=3, dpi=100)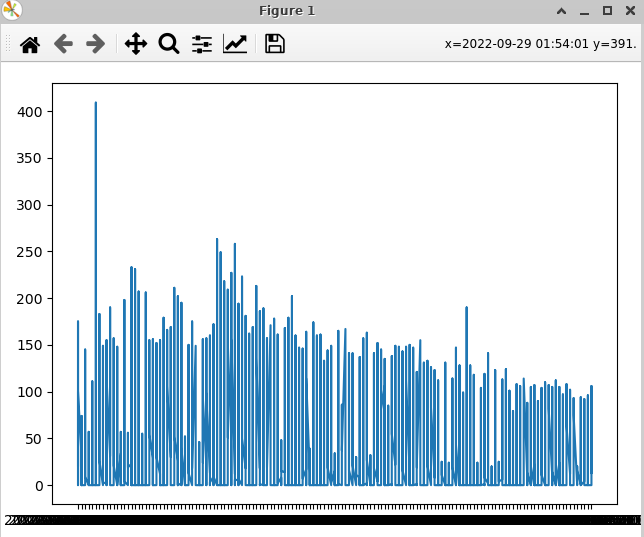
➕ 다른 코드로 도전
import matplotlib.pyplot as plt
from matplotlib.animation import FuncAnimation
import pandas as pd


plt.style.use('seaborn')
fig = plt.figure()
ax = fig.add_subplot(1,1,1)


def animation(i):
  AAPL_STOCK = pd.read_csv('/home/ubuntu/FPDS/20220929/sendinginfo_20220929.csv')
  AAPL_STOCK = AAPL_STOCK[:20000]
  x = []
  y = []

  x = AAPL_STOCK[0:i]['insert_date_time']
  y = AAPL_STOCK[0:i]['cnt_mt1']

  ax.clear()
  ax.plot(x, y)

animation = FuncAnimation(fig, func=animation, interval=1)
plt.show()

animation.save('animation1.gif', writer='imagemagick', fps=3, dpi=100)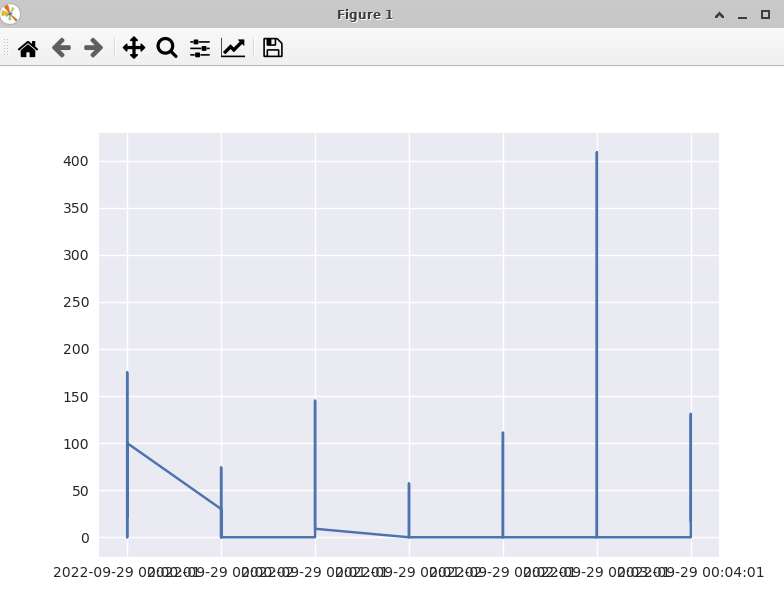
➕ 두개 변수 그래프 도전
import random
from itertools import count
import pandas as pd
import matplotlib.pyplot as plt
from matplotlib.animation import FuncAnimation
from pandas.core.indexes import interval

fig = plt.figure()
ax = plt.axes(xlim=(0, 10), ylim=(-10, 500))
line, = ax.plot([], [], lw=3)


def animate(i):
    data = pd.read_csv("/home/ubuntu/FPDS/20220929/sendinginfo_20220929.csv")
    #data = load_file(temp)
    data = data[:30000]
    print(data.columns)
    # data =pd.read_csv('data4.csv')
    x = data['insert_date_time']
    y1 = data['cnt_mt1']
    y2 = data['cnt_wait']

    plt.cla()
    plt.plot(x,y1, label='cnt_mt1')
    plt.plot(x,y2,label='cnt_wait')

    plt.legend(loc = 'upper left')
    plt.tight_layout()
    line.set_data(x, y1)

    return line,

# ani = FuncAnimation(plt.gcf(), animate, interval = 10)
ani = FuncAnimation(plt.gcf(), animate, interval = 100)
# (Figure 객체, 프레임마다 반복해서 호출할 함수, 반복 가능한 객체를 입력, 프레임 간격)

plt.tight_layout()
plt.show()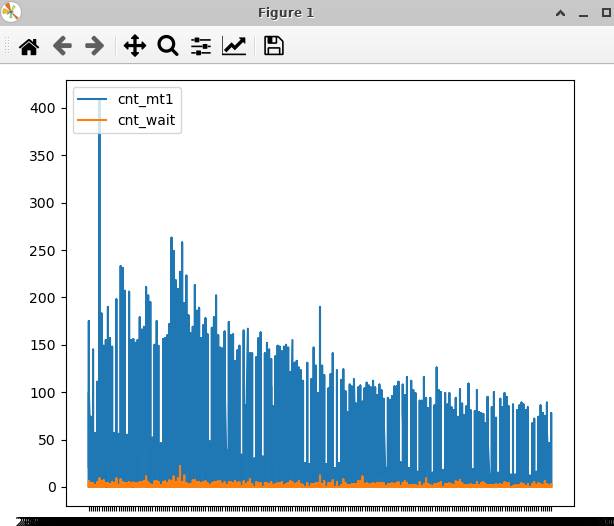
728x90
반응형
'👩💻 인공지능 (ML & DL) > Serial Data' 카테고리의 다른 글
| [FuncAnimation] 3. Mongo DB에 시계열 데이터 저장하기 (1) (0) | 2022.10.24 |
|---|---|
| [FuncAnimation] 2. 단일변량 그래프를 만들어서 GUI로 시각화하기 (0) | 2022.10.24 |
| 비트코인 차트데이터 분석하기 (0) | 2022.10.07 |
| 시계열 데이터 분해 (정적, 비정적 데이터) (0) | 2022.10.06 |
| Time series 시계열 데이터 분류하기 (0) | 2022.10.06 |
'👩💻 인공지능 (ML & DL)/Serial Data' Related Articles
more


Comments