
😎 공부하는 징징알파카는 처음이지?
tsod: Anomaly Detection for time series data 본문
👩💻 인공지능 (ML & DL)/Serial Data
tsod: Anomaly Detection for time series data
징징알파카 2022. 9. 15. 11:29728x90
반응형
220915 작성
<본 블로그는 DHI/tsod 님과 dhi 님의 github를 참고해서 공부하며 작성하였습니다 :-) >
tsod: Anomaly Detection for time series data. — tsod documentation
dhi.github.io
GitHub - DHI/tsod: Anomaly Detection for time series data
Anomaly Detection for time series data. Contribute to DHI/tsod development by creating an account on GitHub.
github.com
😎 tsod 란?
- 이상 현상은 경계 조건 또는 실시간 결정 시스템으로 수치 시뮬레이션 엔진에 데이터를 제공하기 전에 자동으로 감지되고 보다 실현 가능한 값으로 대체되어야 함
- 시계열의 이상 감지를 위한 간단하고 일관된 API
- 시계열 데이터용 라이브러리
- 시계열 형식은 항상 Series
- 어떤 경우에는 DatetimeIndex
- 두가지 유형 감지
- Outlier detection (unsupervised anomaly detection)
- 훈련 데이터는 이상치, 즉 대부분의 다른 관찰에서 멀리 떨어진 관찰을 포함
- 이상값 감지기는 유사하고 서로 가까운 학습 데이터의 관측값에 집중하려고 하고 더 멀리 있는 관측값은 무시
- Novelty detection (semi-supervised anomaly detection)
- 훈련 데이터는 "정상"으로 간주되며 이상값에 의해 오염되지 않음
- 새로운 테스트 데이터 관찰은 이상치로 분류될 수 있으며 이러한 맥락에서 "novelty" 이라 불림
- Outlier detection (unsupervised anomaly detection)
😎 코드 구현
1️⃣ 필요한 라이브러리 & 패키치 로드
- 필요한 tsod 설치
!pip install tsod # from PyPI
!pip install https://github.com/DHI/tsod/archive/main.zip # dev version- 라이브러리 로드
import numpy as np
import pandas as pd
import matplotlib.pyplot as plt
import tsod
2️⃣ 데이터 로드
df = pd.read_csv("https://raw.githubusercontent.com/DHI/tsod/main/tests/data/example.csv", parse_dates=True, index_col=0)
df.head()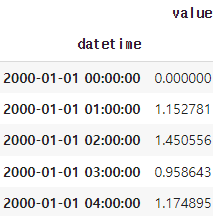
series = df.value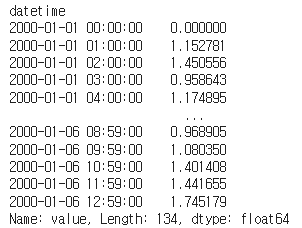
- Series 형태로 데이터 갖고오기
type(series)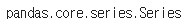
3️⃣ 감지기 로드
- 감지기를 선택 ( RangeDetector or ConstantValueDetector )
- 범위를 벗어난 값을 감지
- tsod.RangeDetector(min_value=- inf, max_value=inf, quantiles=None)
- min_value (float) : 최소값 임계값
- max_value (float) : 최대값 임계값
- quantiles (list[2]) : 기본 quantiles [0, 1] (최소값 및 최대값과 동일)
- 이상 감지 detect()
- 이상 감지
- detect(data: Union[pandas.core.series.Series, pandas.core.frame.DataFrame])
- data (pd.Series) : 가능한 변칙이 있는 시계열 데이터
- Returns : bool이 있는 시계열, True == anomaly
- Return type : pd.Series
rd = tsod.RangeDetector(min_value=0.01, max_value=2.0)

res = rd.detect(series)
series[res]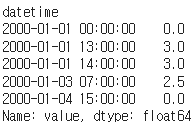
plt.plot(series)
plt.plot(series[res], 'ro',label='Anomaly')
plt.legend()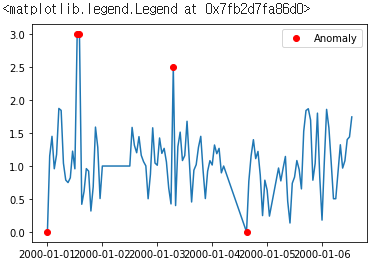
3️⃣ Constant value
- ConstantValueDetector()
- 더 오랜 기간 동안 상수 값을 감지
- 일반적으로 일정한 수준에서 멈추는 센서 오류로 인해 발생
- tsod.ConstantValueDetector(window_size: int = 3, threshold: float = 1e-07)
- window_size ( int ) : 창 범위는 [(i - window_size):(i + window_size)]이므로 배열 요소의 수로 계산되는 창의 절반 (이상으로 간주할 최소 창, 기본값 3)
- 임계값 ( float ) : 이상값을 표시하기 위한 임계값 (낮은 임계값은 값이 이상값으로 간주되는 범위를 "좁게, 기본값=3.0)
cd = tsod.ConstantValueDetector()

res = cd.detect(series)
series[res]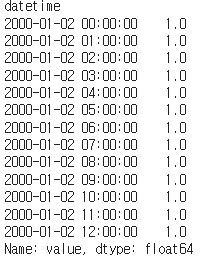
plt.plot(series)
plt.plot(series[res], 'ro',label='Anomaly')
plt.legend()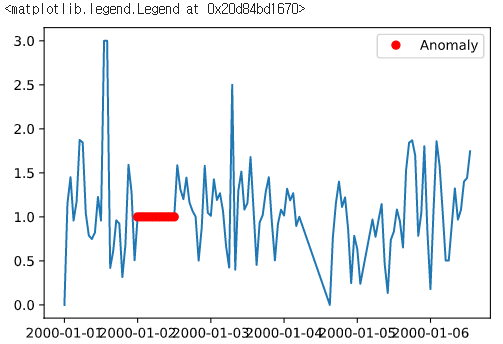
4️⃣ Combination
- CombinedDetector()
- 감지기를 결합
- 여러 가지 이상 탐지 전략을 결합된 탐지기로 결합하는 것이 가능
- tsod.CombinedDetector(detectors)
combined = tsod.CombinedDetector([tsod.RangeDetector(max_value=2.0),
                                     tsod.ConstantValueDetector()])

res = combined.detect(series)
series[res]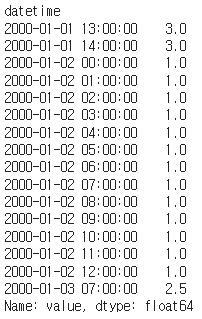
plt.plot(series)
plt.plot(series[res], 'ro',label='Anomaly')
plt.legend()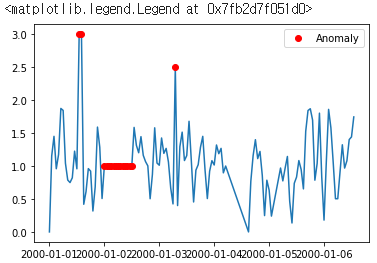
5️⃣ Constant Gradient
- ConstantGradientDetector()
- 일정한 기울기를 감지
- 긴 간격에 대한 선형 보간으로 인해 발생
- tsod.ConstantGradientDetector(window_size: int = 3)
- window_size ( int ) : 이상으로 간주할 최소 창, 기본값 3
cgd = tsod.ConstantGradientDetector()

res = cgd.detect(series)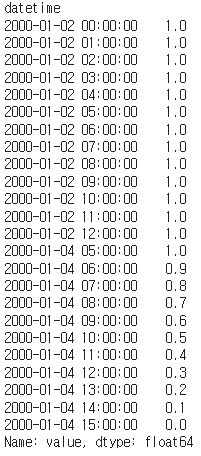
plt.figure(figsize=(16,4))
plt.plot(series)
plt.plot(series[res], 'ro',label='Anomaly')
plt.legend()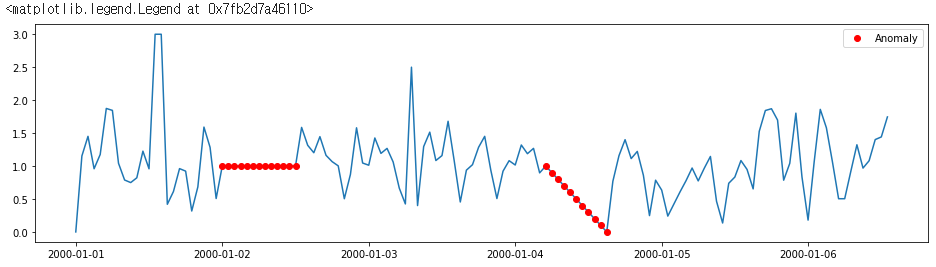
6️⃣ Gradient
- GradientDetector()
- 급격한 변화 감지
- tsod.GradientDetector(max_gradient=inf, direction='both')
- max_gradient ( float ) : 초당 최대 변화율, 기본 np.inf
- direction ( str ) : 양수, 음수 또는 둘 다, 기본값='both'
magd = tsod.GradientDetector()
magd.fit(series[0:10])

res = magd.detect(series)
series[res]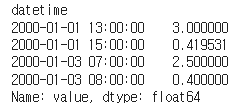
plt.figure(figsize=(16,4))
plt.plot(series)
plt.plot(series[res], 'ro',label='Anomaly')
plt.legend()
plt.title(magd)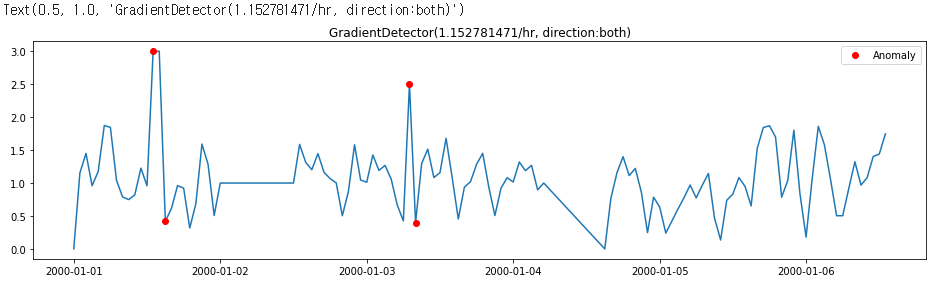
7️⃣ Rolling standard deviation
- 갑작스러운 큰 변화를 감지하는 데 사용
normal_data = pd.Series(np.random.normal(size=100,scale=0.3) + 10.0*np.sin(np.linspace(0,2*np.pi,num=100)))
abnormal_data = pd.Series(np.random.normal(size=20,scale=5.0) + normal_data.iloc[-1])

all_data = pd.concat([normal_data,abnormal_data,normal_data[21:]],ignore_index=True)

all_data[150]= 5.0

all_data.plot()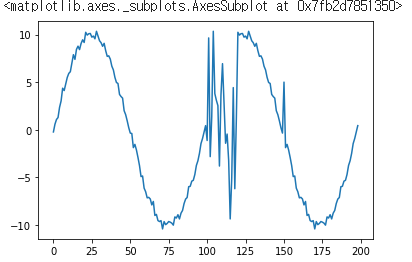
- 모든 데이터가 허용 가능한 범위 내에 있지만 변동이 예상보다 크므로 비정상
rsd = tsod.RollingStandardDeviationDetector(window_size=10, center=True)
rsd.fit(normal_data)

res = rsd.detect(all_data)
all_data[res]
plt.figure(figsize=(16,4))
plt.plot(all_data)
plt.plot(all_data[res], 'ro',label='Anomaly')
plt.legend()
plt.title(rsd)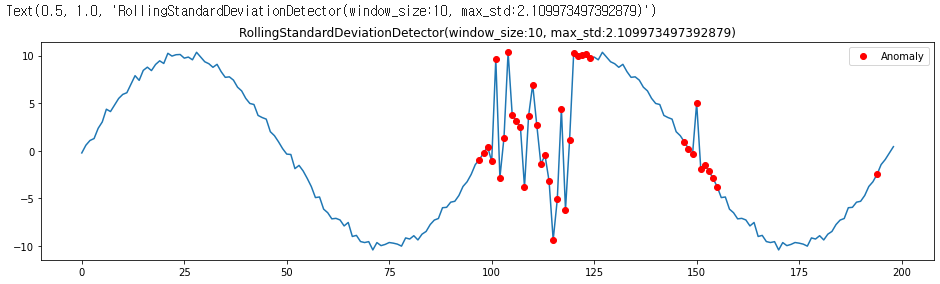
8️⃣ Diff
- 경과 시간을 고려하지 않고 급격한 변화를 감지
drd = tsod.DiffDetector()
drd.fit(normal_data)

res = drd.detect(all_data)
all_data[res]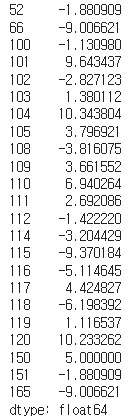
plt.figure(figsize=(16,4))
plt.plot(all_data)
plt.plot(all_data[res], 'ro',label='Anomaly')
plt.legend()
plt.title(drd)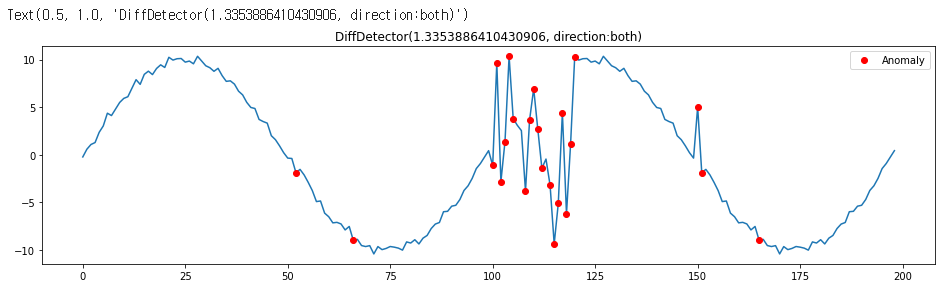
728x90
반응형
'👩💻 인공지능 (ML & DL) > Serial Data' 카테고리의 다른 글
| [Kaggle] Web traffic time series forecast (0) | 2022.09.16 |
|---|---|
| [논문리뷰] Comparison between ARIMA and Deep Learning Modelsfor Temperature Forecasting (1) | 2022.09.15 |
| [DACON] 동서발전 태양광 발전량 예측 AI 경진대회 (0) | 2022.09.14 |
| 시계열 모델 ARIMA 2 (자기회귀 집적 이동 평균) (0) | 2022.09.08 |
| [DACON] HAICon2020 산업제어시스템 보안위협 탐지 AI & 비지도 기반 Autoencoder (0) | 2022.09.08 |
'👩💻 인공지능 (ML & DL)/Serial Data' Related Articles
more


Comments