
😎 공부하는 징징알파카는 처음이지?
[Kaggle]Breast Cancer Wisconsin (Diagnostic) Data Set_유방암 분류 본문
👩💻 컴퓨터 구조/Kaggle
[Kaggle]Breast Cancer Wisconsin (Diagnostic) Data Set_유방암 분류
징징알파카 2022. 1. 28. 01:27728x90
반응형
220128 작성
<본 블로그는 Kaggle 을 참고해서 공부하며 작성하였습니다>
https://bigdaheta.tistory.com/33
[머신러닝] 캐글(kaggle)예제 - 위스콘신 유방암 예측 데이터 분석 (Wisconsin Diagnostic breast cancer datase
위스콘신 유방암 데이터 세트는 종양의 크기, 모양 등의 다양한 속성 값을 기반으로 해당 종양이 악성(malignmant)인지 양성 (benign)인지를 분류한 데이터 세트이다. 이 데이터 세트를 앙상블(투표,
bigdaheta.tistory.com
유방암 악성 종양인지
양성 종양인지
이진 분류 해보자!
1. 라이브러리 import
import numpy as np
import matplotlib.pyplot as plt

import pandas as pd
from sklearn import datasets

from sklearn.model_selection import train_test_split

from sklearn.tree import DecisionTreeClassifier
from sklearn.neighbors import KNeighborsClassifier
from sklearn.linear_model import LogisticRegression

from sklearn.ensemble import VotingClassifier
from sklearn.ensemble import RandomForestClassifier
from sklearn.ensemble import AdaBoostClassifier

from sklearn.metrics import confusion_matrix, classification_report
from sklearn.metrics import accuracy_score, precision_score, recall_score, f1_score, roc_auc_score
from sklearn.metrics import roc_curve, auc

from sklearn.model_selection import learning_curve, validation_curve
from sklearn.model_selection import GridSearchCV
from sklearn.model_selection import cross_val_predict
from sklearn.model_selection import cross_val_score
2. 데이터 가져오기
data = pd.read_csv("data.csv")
data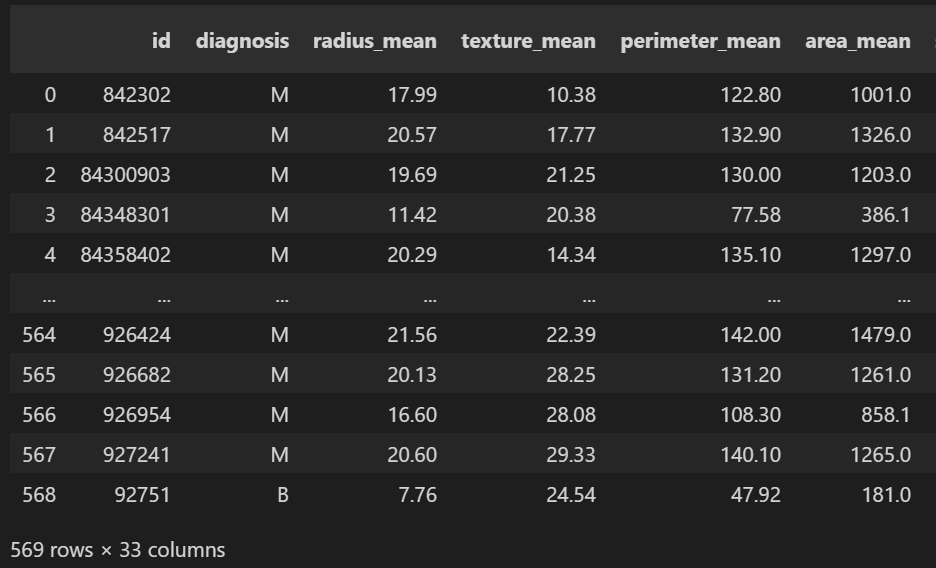
data.info()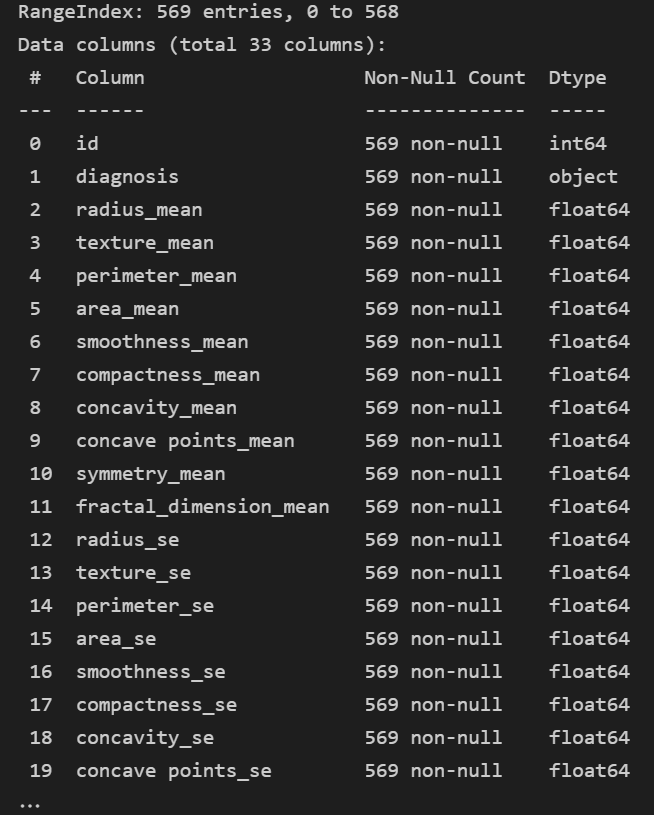
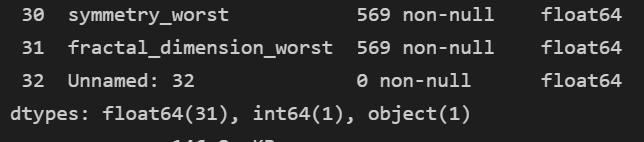
- 일단 float 이나 int 만 보인다... object 는 안보인다
data.isnull().sum()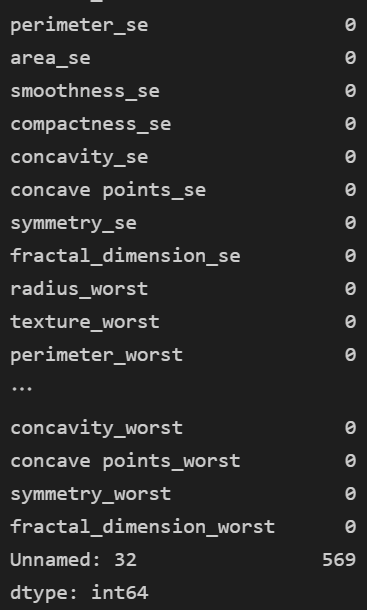
- Unnamed:32 null 존재!
3. 데이터 전처리
1) diagnosis 숫자로
data["diagnosis"].unique()
- '양성종양(Benign tumor)'과 '악성종양(Malignant tumor)
- 악성종양을 1, 양성양성을 0
def cancle(a):
    if 'M' in a :
        return 1
    else :
        return 0

data["판정"] = data["diagnosis"].apply(cancle)
data.head(10)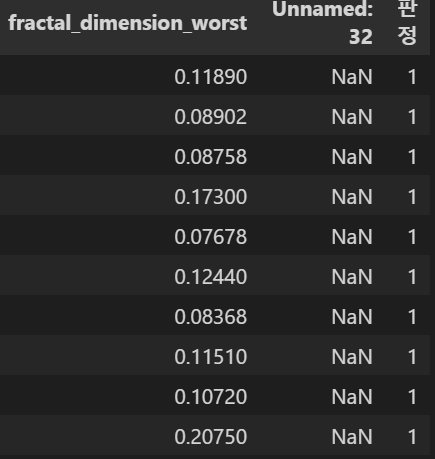
2) 필요없는거 drop
data.columns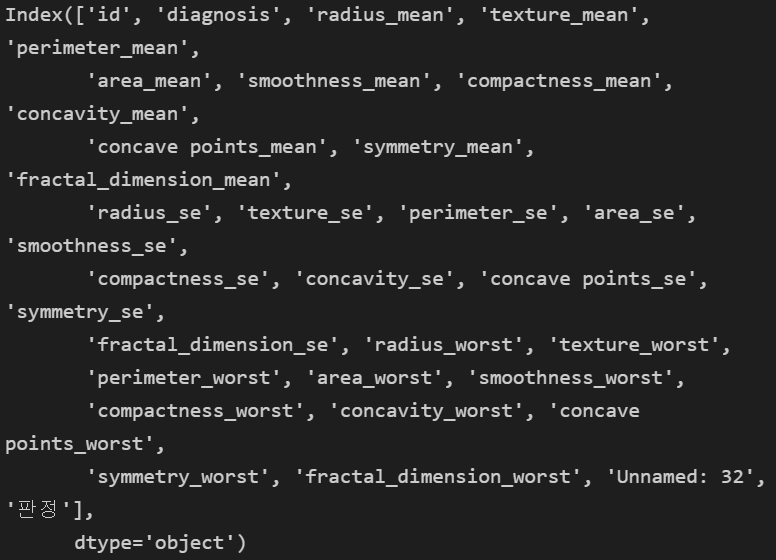
- id 필요없고, diagnosis 는 숫자로 했고, null 있는 Unnamed: 32 없애버려~!
total = data.drop(columns= ["id", "diagnosis", "Unnamed: 32"])
total.head()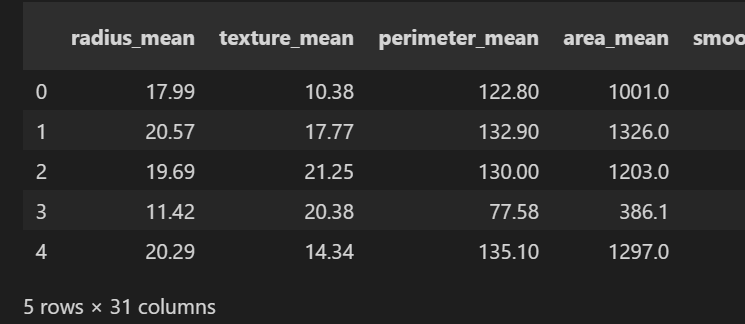
4. train/test 분할
X = total.drop(['판정'], axis = 1) # 칼럼으로
y = total["판정"]
X_train, X_test, y_train, y_test = train_test_split(X, y, test_size=0.2, random_state=42, stratify=y)- test_size에는 test set의 비율을 입력
- stratify에는 층 구분 변수이름을 입력 -> 각 층별로 나누어서 test_size비율 적용 추출
- shuffle=True 를 지정해주면 무작위 추출(random sampling)
- 체계적 추출(systematic sampling)을 하고 싶다면 shuffle=False를 지정
- random_state 는 재현가능성을 위해서 난수 초기값으로 아무 숫자나 지정
5. 모델 구축
1) voting : 뭐가 제일 낫나~
- 다수의 분류기의 레이블 값 결정 확률을 모두 더하고 평균낸 확률 값이 가장 높은 레이블을 최종 보팅 결과값으로 선정 => 소프트 보팅
- 다수의 분류기가 예측한 예측값을 최종 보팅 결과값으로 선정 => 하드 보팅
logistic = LogisticRegression( solver = "liblinear",
                        penalty = "l2",
                        C = 0.001,
                        random_state = 1)
tree = DecisionTreeClassifier(max_depth = None,
                        criterion="entropy",
                        random_state=1)
knn = KNeighborsClassifier(n_neighbors=1,
                        p = 2,
                        metric = "minkowski")

voting_estimators = [("logistic", logistic), ("tree", tree), ("knn", knn)]

voting = VotingClassifier(estimators=voting_estimators,
                        voting = "soft")

clf_labels1 = ["Logistic regression", "Decision Tree", "KNN", "Majority voting"]

all_clf1 = [logistic, tree, knn, voting]
2) 배깅 : 여러 가지 분류 모델 중 한가지 모델에만 집중 모델 구축
tree = DecisionTreeClassifier (max_depth= None,
                        criterion="entropy",
                        random_state=1)
forest = RandomForestClassifier(criterion="gini",
                        n_estimators=500,   # 데이터 샘플 몇개
                        random_state=1)
clf_labels2 = ["Decision Tree", "Random Forest"]
all_clf2 = [tree, forest]
3) 부스팅
tree = DecisionTreeClassifier(max_depth=1,
                    criterion="entropy",
                    random_state=1)
adaboost = AdaBoostClassifier (base_estimator=tree,
                    n_estimators=500,
                    learning_rate = 0.1,
                    random_state=1)

clf_labels3 = ["Decision Tree", "Ada Boost"]
all_clf3 = [tree, adaboost]
4) AUC
for clf, label in zip(all_clf1, clf_labels1) :
    scores = cross_val_score(estimator=clf,
                    X = X_train,
                    y = y_train,
                    cv = 10,
                    scoring ="roc_auc")
    print("ROC AUC : %.3f ( +/- %.3f) [%s]"
            % (scores.mean(), scores.std(), label))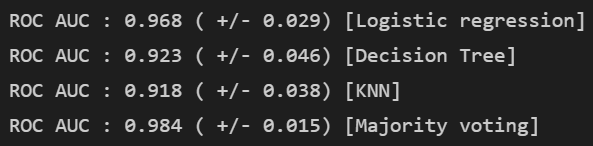
- 음 Voting 이 높다
for clf, label in zip(all_clf2, clf_labels2) :
    scores = cross_val_score(estimator=clf,
                    X = X_train,
                    y = y_train,
                    cv = 10,
                    scoring ="roc_auc")
    print("ROC AUC : %.3f ( +/- %.3f) [%s]"
            % (scores.mean(), scores.std(), label))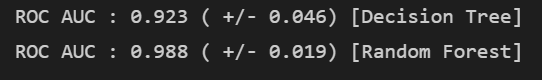
- 랜덤 포레스트가 좋다
for clf, label in zip(all_clf3, clf_labels3) :
    scores = cross_val_score(estimator=clf,
                    X = X_train,
                    y = y_train,
                    cv = 10,
                    scoring ="roc_auc")
    print("ROC AUC : %.3f ( +/- %.3f) [%s]"
            % (scores.mean(), scores.std(), label))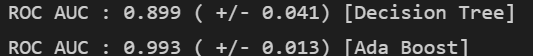
- AdaBoost 가 좋다
6. ROC 곡선 그리기
colors = ["orange", "pink","blue", "green"]
linestyles = [':', "--", "-.", "-"]

for clf, label, clr, ls in zip(all_clf1, clf_labels1, colors, linestyles) :
    clf.fit(X_train, y_train)
    y_pred = clf.predict_proba(X_test)[:,1]
    fpr, tpr, threshold = roc_curve(y_true = y_test,
                                    y_score=y_pred)
    roc_auc = auc(x=fpr, y=tpr)

    plt.plot(fpr, tpr, color = clr, linestyle = ls,
                label ="%s (auc = %.3f) " %(label, roc_auc))

plt.legend(loc = "lower right")
plt.plot([0,1], [0,1], linestyle = "--", color = "gray", linewidth = 2)

plt.xlim([-0.1, 1.1])
plt.ylim([-0.1, 1.1])

plt.grid(alpha = 0.5)

plt.xlabel("False positive rate (FPR)")
plt.ylabel("True positive rate (TPR)")

plt.title("Voting")
plt.show()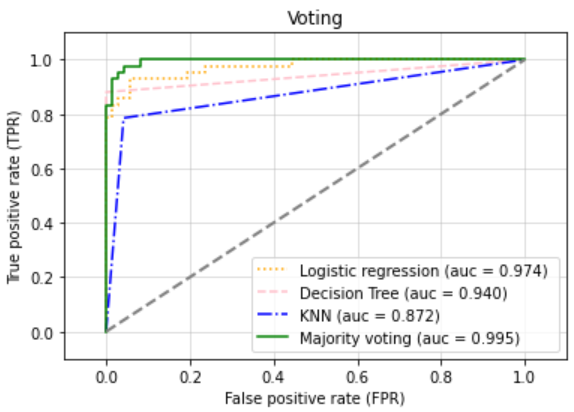
colors = ["orange", "pink","blue", "green"]
linestyles = [':', "--", "-.", "-"]

for clf, label, clr, ls in zip(all_clf2, clf_labels2, colors, linestyles) :
    clf.fit(X_train, y_train)
    y_pred = clf.predict_proba(X_test)[:,1]
    fpr, tpr, threshold = roc_curve(y_true = y_test,
                                    y_score=y_pred)
    roc_auc = auc(x=fpr, y=tpr)

    plt.plot(fpr, tpr, color = clr, linestyle = ls,
                label ="%s (auc = %.3f) " %(label, roc_auc))

plt.legend(loc = "lower right")
plt.plot([0,1], [0,1], linestyle = "--", color = "gray", linewidth = 2)

plt.xlim([-0.1, 1.1])
plt.ylim([-0.1, 1.1])

plt.grid(alpha = 0.5)

plt.xlabel("False positive rate (FPR)")
plt.ylabel("True positive rate (TPR)")

plt.title("RandomForest")
plt.show()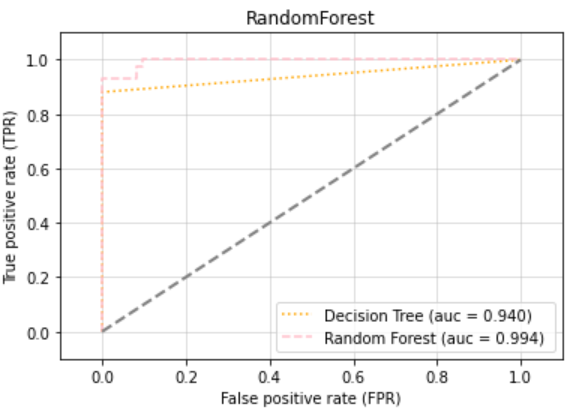
colors = ["orange", "pink","blue", "green"]
linestyles = [':', "--", "-.", "-"]

for clf, label, clr, ls in zip(all_clf3, clf_labels3, colors, linestyles) :
    clf.fit(X_train, y_train)
    y_pred = clf.predict_proba(X_test)[:,1]
    fpr, tpr, threshold = roc_curve(y_true = y_test,
                                    y_score=y_pred)
    roc_auc = auc(x=fpr, y=tpr)

    plt.plot(fpr, tpr, color = clr, linestyle = ls,
                label ="%s (auc = %.3f) " %(label, roc_auc))

plt.legend(loc = "lower right")
plt.plot([0,1], [0,1], linestyle = "--", color = "gray", linewidth = 2)

plt.xlim([-0.1, 1.1])
plt.ylim([-0.1, 1.1])

plt.grid(alpha = 0.5)

plt.xlabel("False positive rate (FPR)")
plt.ylabel("True positive rate (TPR)")

plt.title("AdaBoost")
plt.show()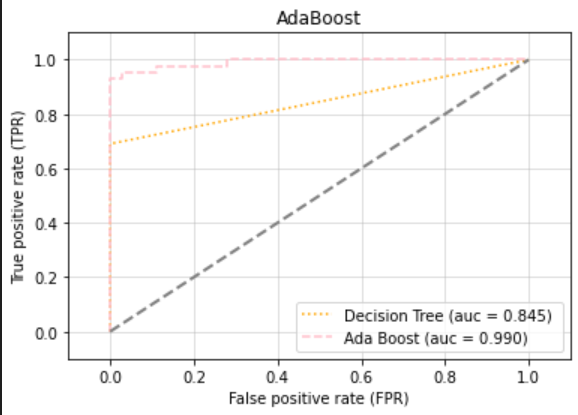
7. 정오 분류표
forest.fit(X_train, y_train)

y_pred = forest.predict(X_test)

print("RandomForest")
print("잘못 분류된 샘플 개수 : %d" %(y_test != y_pred).sum())
print("정확도 : %.3f" % accuracy_score(y_test, y_pred))
print("정밀도 : %.3f" % precision_score(y_true = y_test, y_pred = y_pred))
print("재현율 : %.3f" % recall_score(y_true=y_test, y_pred=y_pred))
print("F1 : %.3f" % f1_score(y_true=y_test, y_pred=y_pred))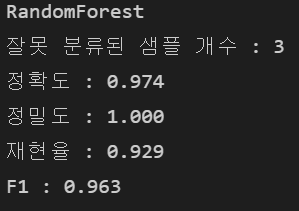
adaboost.fit(X_train, y_train)

y_pred = forest.predict(X_test)

print("AdaBoost")
print("잘못 분류된 샘플 개수 : %d" %(y_test != y_pred).sum())
print("정확도 : %.3f" % accuracy_score(y_test, y_pred))
print("정밀도 : %.3f" % precision_score(y_true = y_test, y_pred = y_pred))
print("재현율 : %.3f" % recall_score(y_true=y_test, y_pred=y_pred))
print("F1 : %.3f" % f1_score(y_true=y_test, y_pred=y_pred))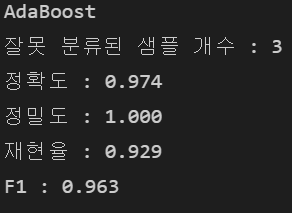
8. 최적화
voting.get_params()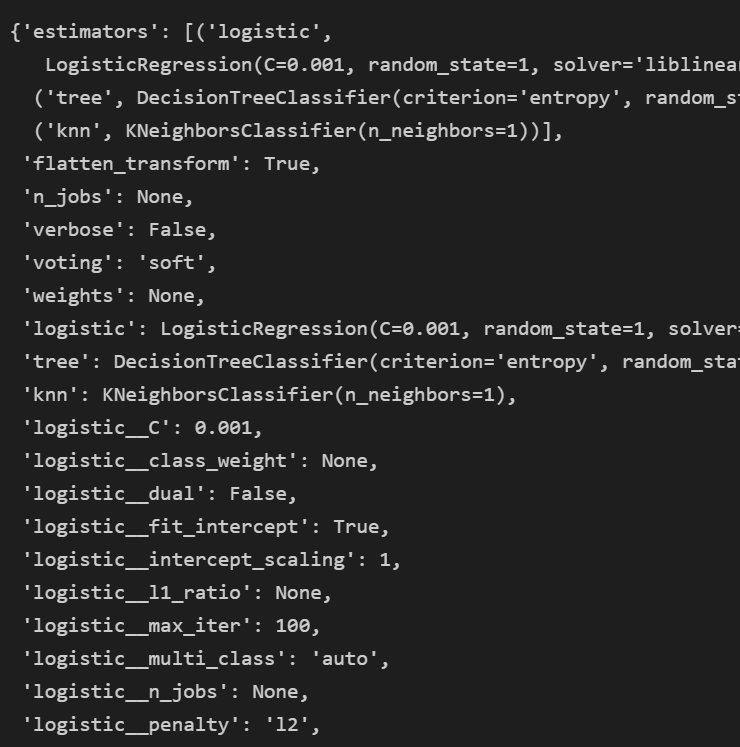
params = {"logistic__C" : [0.001, 0.1, 100.0],
        "tree__max_depth" : [1, 2, 3, 4, 5],
        "knn__n_neighbors" : [1, 2, 3, 4, 5]}

grid = GridSearchCV(estimator=voting,
                    param_grid=params,
                    cv = 10,
                    scoring = "roc_auc",
                    )

grid.fit(X_train, y_train)

for i, _ in enumerate(grid.cv_results_["mean_test_score"]) :
    print("%.3f +/- %.3f %r"
            %(grid.cv_results_["mean_test_score"][i],
            grid.cv_results_["std_test_score"][i] / 2.0,
            grid.cv_results_["params"][i]))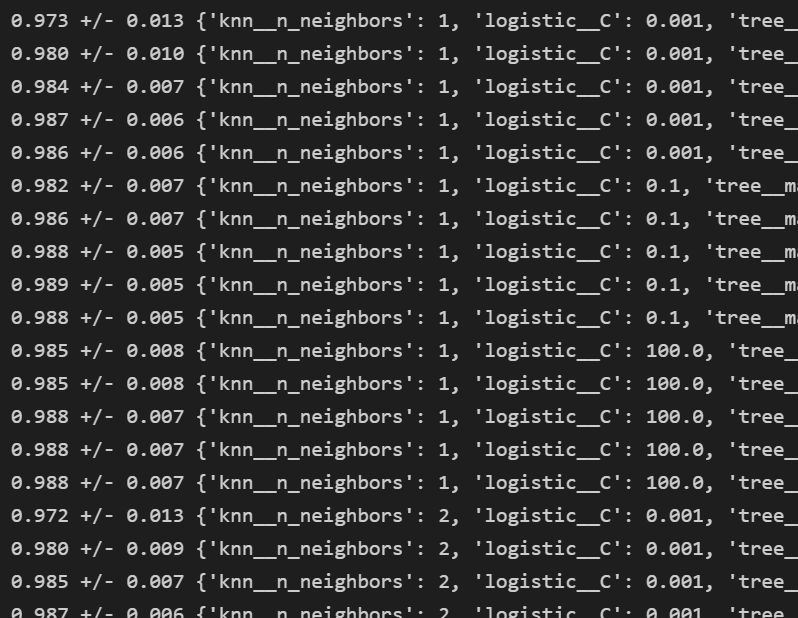
print("최적의 파라미터 : %s" %grid.best_params_)
print("ACU : %.3f" % grid.best_score_)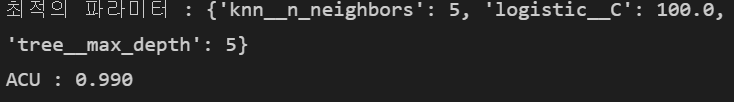
9. 특성 중요도
- 랜덤 포레스트는 별도의 파라미터 튜닝 필요 없음
feat_labels = X.columns
importances = forest.feature_importances_
indices = np.argsort(importances)[::-1]
for i in range(X_train.shape[1]) :
print("%2d) %-*s %f" % (i + 1, 30, feat_labels[indices[i]],
importances[indices[i]]))
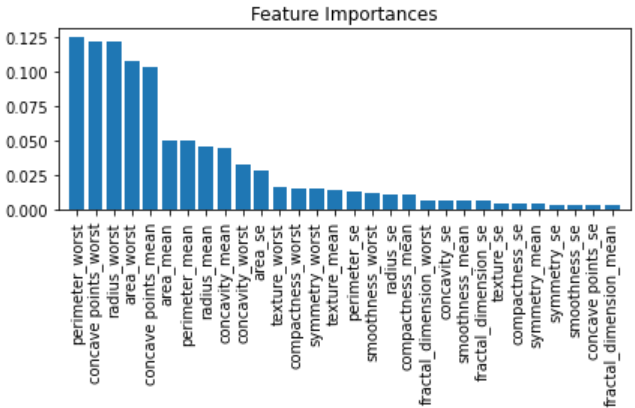
plt.title("Feature Importances")
plt.bar(range(X_train.shape[1]), importances[indices], align="center")
plt.xticks(range(X_train.shape[1]), feat_labels[indices], rotation = 90)
plt.xlim([-1, X_train.shape[1]])
plt.tight_layout()
plt.show()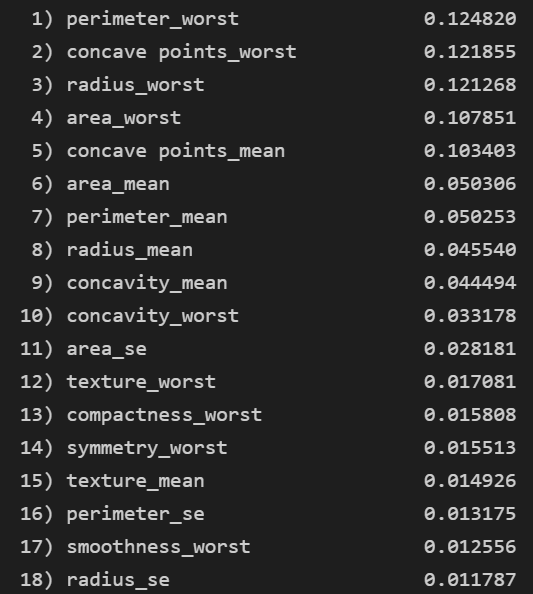
728x90
반응형
'👩💻 컴퓨터 구조 > Kaggle' 카테고리의 다른 글
| [Kaggle]Super Image Resolution_고화질 이미지 만들기 (0) | 2022.02.07 |
|---|---|
| [Kaggle] CNN Architectures (0) | 2022.02.04 |
| [Kaggle] HeartAttack 예측 (0) | 2022.01.31 |
| [Kaggle] Chest X-Ray 폐암 이미지 분류하기 (0) | 2022.01.29 |
| [Kaggle]MBTI_Myers-Briggs Personality Type Dataset(성격연구) (0) | 2022.01.22 |
'👩💻 컴퓨터 구조/Kaggle' Related Articles
more


Comments